

PDF file - Department of Health and Ageing
PDF file - Department of Health and Ageing
PDF file - Department of Health and Ageing

Create successful ePaper yourself
Turn your PDF publications into a flip-book with our unique Google optimized e-Paper software.
National Notifiable Diseases Surveillance System, 2004<br />
Annual report<br />
The highest rates were reported from the Northern<br />
Territory (6.0 cases per 100,000 population,<br />
12 cases), Tasmania (3.7 cases per 100,000 population,<br />
18 cases) <strong>and</strong> the Australian Capital Territory<br />
(3.4 cases per 100,000 population, 11 cases). There<br />
was a small excess <strong>of</strong> cases among males (male<br />
to female ratio 1.2:1). The largest number <strong>of</strong> cases<br />
occurred in winter <strong>and</strong> spring (Figure 64).<br />
Figure 64. Trends in notification rates <strong>of</strong><br />
meningococcal infection, Australia, 2002 to<br />
2004, by month <strong>of</strong> notification<br />
Rate per 100,000 population<br />
6<br />
5<br />
4<br />
3<br />
2<br />
1<br />
0<br />
Jan<br />
2002<br />
Apr Jul Oct Jan<br />
2003<br />
Apr Jul Oct Jan<br />
2004<br />
Month <strong>and</strong> year <strong>of</strong> notification<br />
Apr Jul Oct<br />
Of the 408 meningococcal notifi cations in 2004,<br />
342 (84%) were serogrouped. Of these 248 (73%)<br />
were serogroup B, 75 (22%) were serogroup C,<br />
<strong>and</strong> 19 (6%) were infections with serogroup Y,<br />
serogroup W135 or serogroup A (Table 25). In 2003,<br />
<strong>of</strong> 465 serogrouped notifi cations, 289 (62%) were<br />
serogroup B, <strong>and</strong> 158 (34%) were serogroup C.<br />
Overall, the highest age specifi c rate was in children<br />
aged 0–4 years with a rate <strong>of</strong> 10.4 cases per<br />
100,000 population. Of these cases, 99 (75%),<br />
were serogroup B infection. In the 15–19 year age<br />
group, the overall rate <strong>of</strong> meningococcal infection<br />
was 4.8 cases per 100,000 population, 56 per cent<br />
(37 cases) <strong>of</strong> which were serogroup C.<br />
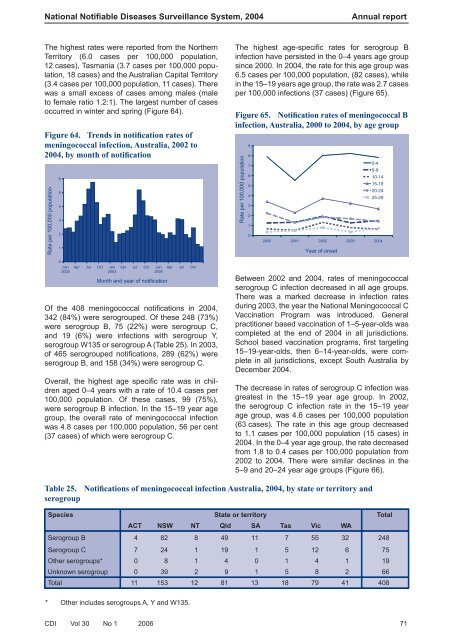
The highest age-specifi c rates for serogroup B<br />
infection have persisted in the 0–4 years age group<br />
since 2000. In 2004, the rate for this age group was<br />
6.5 cases per 100,000 population, (82 cases), while<br />
in the 15–19 years age group, the rate was 2.7 cases<br />
per 100,000 infections (37 cases) (Figure 65).<br />
Figure 65. Notification rates <strong>of</strong> meningococcal B<br />
infection, Australia, 2000 to 2004, by age group<br />
Rate per 100,000 population<br />
9<br />
8<br />
7<br />
6<br />
5<br />
4<br />
3<br />
2<br />
1<br />
0<br />
2000 2001 2002 2003 2004<br />
Year <strong>of</strong> onset<br />
Between 2002 <strong>and</strong> 2004, rates <strong>of</strong> meningococcal<br />
serogroup C infection decreased in all age groups.<br />
There was a marked decrease in infection rates<br />
during 2003, the year the National Meningococcal C<br />
Vaccination Program was introduced. General<br />
practitioner based vaccination <strong>of</strong> 1–5-year-olds was<br />
completed at the end <strong>of</strong> 2004 in all jurisdictions.<br />
School based vaccination programs, fi rst targeting<br />
15–19-year-olds, then 6–14-year-olds, were complete<br />
in all jurisdictions, except South Australia by<br />
December 2004.<br />
The decrease in rates <strong>of</strong> serogroup C infection was<br />
greatest in the 15–19 year age group. In 2002,<br />
the serogroup C infection rate in the 15–19 year<br />
age group, was 4.6 cases per 100,000 population<br />
(63 cases). The rate in this age group decreased<br />
to 1.1 cases per 100,000 population (15 cases) in<br />
2004. In the 0–4 year age group, the rate decreased<br />
from 1.8 to 0.4 cases per 100,000 population from<br />
2002 to 2004. There were similar declines in the<br />
5–9 <strong>and</strong> 20–24 year age groups (Figure 66).<br />
0-4<br />
5-9<br />
10-14<br />
15-19<br />
20-24<br />
25-29<br />
Table 25. Notifications <strong>of</strong> meningococcal infection Australia, 2004, by state or territory <strong>and</strong><br />
serogroup<br />
Species State or territory Total<br />
ACT NSW NT Qld SA Tas Vic WA<br />
Serogroup B 4 82 8 49 11 7 55 32 248<br />
Serogroup C 7 24 1 19 1 5 12 6 75<br />
Other serogroups* 0 8 1 4 0 1 4 1 19<br />
Unknown serogroup 0 39 2 9 1 5 8 2 66<br />
Total 11 153 12 81 13 18 79 41 408<br />
* Other includes serogroups A, Y <strong>and</strong> W135.<br />
CDI Vol 30 No 1 2006 71


