DHB 2006/07 - Health Systems Trust
DHB 2006/07 - Health Systems Trust
DHB 2006/07 - Health Systems Trust

Create successful ePaper yourself
Turn your PDF publications into a flip-book with our unique Google optimized e-Paper software.
Section B: District and Province Profiles<br />
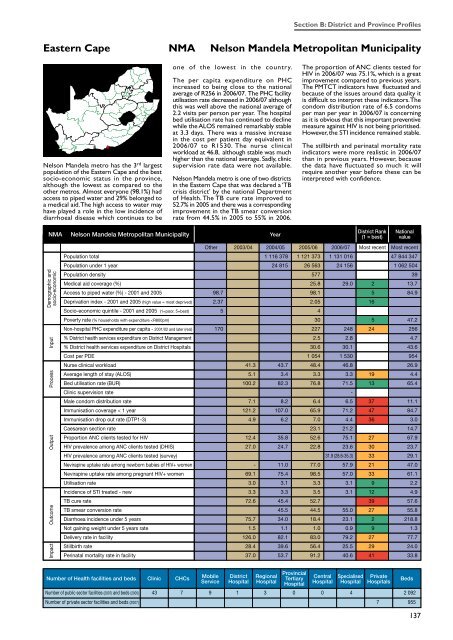
Eastern Cape NMA Nelson Mandela Metropolitan Municipality<br />
Nelson Mandela metro has the 3 rd largest<br />
population of the Eastern Cape and the best<br />
socio-economic status in the province,<br />
although the lowest as compared to the<br />
other metros. Almost everyone (98.1%) had<br />
access to piped water and 29% belonged to<br />
a medical aid. The high access to water may<br />
have played a role in the low incidence of<br />
diarrhoeal disease which continues to be<br />
one of the lowest in the country.<br />
The per capita expenditure on PHC<br />
increased to being close to the national<br />
average of R256 in <strong>2006</strong>/<strong>07</strong>. The PHC facility<br />
utilisation rate decreased in <strong>2006</strong>/<strong>07</strong> although<br />
this was well above the national average of<br />
2.2 visits per person per year. The hospital<br />
bed utilisation rate has continued to decline<br />
while the ALOS remained remarkably stable<br />
at 3.3 days. There was a massive increase<br />
in the cost per patient day equivalent in<br />
<strong>2006</strong>/<strong>07</strong> to R1530. The nurse clinical<br />
workload at 46.8, although stable was much<br />
higher than the national average. Sadly, clinic<br />
supervision rate data were not available.<br />
Nelson Mandela metro is one of two districts<br />
in the Eastern Cape that was declared a ‘TB<br />
crisis district’ by the national Department<br />
of <strong>Health</strong>. The TB cure rate improved to<br />
52.7% in 2005 and there was a corresponding<br />
improvement in the TB smear conversion<br />
rate from 44.5% in 2005 to 55% in <strong>2006</strong>.<br />
The proportion of ANC clients tested for<br />
HIV in <strong>2006</strong>/<strong>07</strong> was 75.1%, which is a great<br />
improvement compared to previous years.<br />
The PMTCT indicators have fluctuated and<br />
because of the issues around data quality it<br />
is difficult to interpret these indicators. The<br />
condom distribution rate of 6.5 condoms<br />
per man per year in <strong>2006</strong>/<strong>07</strong> is concerning<br />
as it is obvious that this important preventive<br />
measure against HIV is not being prioritised.<br />
However, the STI incidence remained stable.<br />
The stillbirth and perinatal mortality rate<br />
indicators were more realistic in <strong>2006</strong>/<strong>07</strong><br />
than in previous years. However, because<br />
the data have fluctuated so much it will<br />
require another year before these can be<br />
interpreted with confidence.<br />
NMA<br />
Nelson Mandela Metropolitan Municipality<br />
Year<br />
District Rank<br />
(1 = best)<br />
National<br />
value<br />
Demographic and<br />
socio-economic<br />
Impact Outcome Output Process Input<br />
1 116 378 1 121 373 1 131 016 47 844 347<br />
24 815 26 563 24 156 1 062 504<br />
577 39<br />
25.8 29.0 2 13.7<br />
98.7 98.1 5 84.9<br />
2.37 2.05 16<br />
5 4<br />
30 5 47.2<br />
170 227 248 24 256<br />
2.5 2.8 4.7<br />
30.6 30.1 43.6<br />
1 054 1 530 954<br />
41.3 43.7 48.4 46.8 26.9<br />
5.1 3.4 3.3 3.3 19 4.4<br />
100.2 82.3 76.8 71.5 13 65.4<br />
-<br />
7.1 8.2 6.4 6.5 37 11.1<br />
121.2 1<strong>07</strong>.0 65.9 71.2 47 84.7<br />
4.9 6.2 7.0 4.4 36 3.0<br />
23.1 21.2 14.7<br />
12.4 35.8 52.6 75.1 27 67.9<br />
27.0 24.7 22.8 23.6 30 23.7<br />
31.9 (28.6-35.3) 33 29.1<br />
- 11.0 77.0 57.9 21 47.0<br />
69.1 75.4 98.5 57.0 33 61.1<br />
3.0 3.1 3.3 3.1 9 2.2<br />
3.3 3.3 3.5 3.1 12 4.9<br />
72.6 45.4 52.7 39 57.6<br />
45.5 44.5 55.0 27 55.8<br />
75.7 34.0 18.4 23.1 2 218.8<br />
1.5 1.1 1.0 0.9 9 1.3<br />
126.0 82.1 83.0 79.2 27 77.7<br />
28.4 39.6 56.4 25.5 29 24.0<br />
37.0 53.7 91.2 40.6 41 33.8<br />
Number of <strong>Health</strong> facilities and beds Clinic CHCs<br />
Mobile<br />
Service<br />
District<br />
Hospital<br />
Regional<br />
Hospital<br />
Provincial<br />
Tertiary<br />
Hospital<br />
Central<br />
Hospital<br />
Specialised<br />
Hospital<br />
Private<br />
Hospitals<br />
Number of public sector facilities (20<strong>07</strong>) and beds (2005) 43 7 9 1 3 0 0 4 2 092<br />
Number of private sector facilities and beds (20<strong>07</strong>) 7 955<br />
Beds<br />
137