DHB 2006/07 - Health Systems Trust
DHB 2006/07 - Health Systems Trust
DHB 2006/07 - Health Systems Trust

You also want an ePaper? Increase the reach of your titles
YUMPU automatically turns print PDFs into web optimized ePapers that Google loves.
Section B: District and Province Profiles<br />
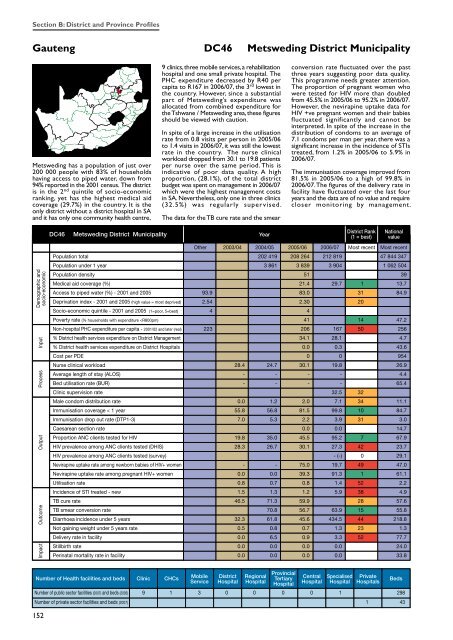
Gauteng DC46 Metsweding District Municipality<br />
Metsweding has a population of just over<br />
200 000 people with 83% of households<br />
having access to piped water, down from<br />
94% reported in the 2001 census. The district<br />
is in the 2 nd quintile of socio-economic<br />
ranking, yet has the highest medical aid<br />
coverage (29.7%) in the country. It is the<br />
only district without a district hospital in SA<br />
and it has only one community health centre,<br />
9 clinics, three mobile services, a rehabilitation<br />
hospital and one small private hospital. The<br />
PHC expenditure decreased by R40 per<br />
capita to R167 in <strong>2006</strong>/<strong>07</strong>, the 3 rd lowest in<br />
the country. However, since a substantial<br />
part of Metsweding’s expenditure was<br />
allocated from combined expenditure for<br />
the Tshwane / Metsweding area, these figures<br />
should be viewed with caution.<br />
In spite of a large increase in the utilisation<br />
rate from 0.8 visits per person in 2005/06<br />
to 1.4 visits in <strong>2006</strong>/<strong>07</strong>, it was still the lowest<br />
rate in the country. The nurse clinical<br />
workload dropped from 30.1 to 19.8 patients<br />
per nurse over the same period. This is<br />
indicative of poor data quality. A high<br />
proportion, (28.1%), of the total district<br />
budget was spent on management in <strong>2006</strong>/<strong>07</strong><br />
which were the highest management costs<br />
in SA. Nevertheless, only one in three clinics<br />
(32.5%) was regularly supervised.<br />
The data for the TB cure rate and the smear<br />
conversion rate fluctuated over the past<br />
three years suggesting poor data quality.<br />
This programme needs greater attention.<br />
The proportion of pregnant women who<br />
were tested for HIV more than doubled<br />
from 45.5% in 2005/06 to 95.2% in <strong>2006</strong>/<strong>07</strong>.<br />
However, the nevirapine uptake data for<br />
HIV +ve pregnant women and their babies<br />
fluctuated significantly and cannot be<br />
interpreted. In spite of the increase in the<br />
distribution of condoms to an average of<br />
7.1 condoms per man per year, there was a<br />
significant increase in the incidence of STIs<br />
treated, from 1.2% in 2005/06 to 5.9% in<br />
<strong>2006</strong>/<strong>07</strong>.<br />
The immunisation coverage improved from<br />
81.5% in 2005/06 to a high of 99.8% in<br />
<strong>2006</strong>/<strong>07</strong>. The figures of the delivery rate in<br />
facility have fluctuated over the last four<br />
years and the data are of no value and require<br />
closer monitoring by management.<br />
DC46<br />
Metsweding District Municipality<br />
Year<br />
District Rank<br />
(1 = best)<br />
National<br />
value<br />
Demographic and<br />
socio-economic<br />
Impact Outcome Output Process Input<br />
202 419 208 264 212 819 47 844 347<br />
3 861 3 839 3 904 1 062 504<br />
51 39<br />
21.4 29.7 1 13.7<br />
93.9 83.0 31 84.9<br />
2.54 2.30 20<br />
4 4<br />
41 14 47.2<br />
223 206 167 50 256<br />
34.1 28.1 4.7<br />
0.0 0.3 43.6<br />
0 0 954<br />
28.4 24.7 30.1 19.8 26.9<br />
- - - - 4.4<br />
- - - - 65.4<br />
32.5 32<br />
0.0 1.2 2.0 7.1 34 11.1<br />
55.8 56.8 81.5 99.8 10 84.7<br />
7.0 5.3 2.2 3.9 31 3.0<br />
0.0 0.0 14.7<br />
19.8 35.0 45.5 95.2 7 67.9<br />
28.3 26.7 30.1 27.3 42 23.7<br />
- (-) 0 29.1<br />
- - 75.0 19.7 49 47.0<br />
0.0 0.0 39.3 91.3 1 61.1<br />
0.8 0.7 0.8 1.4 52 2.2<br />
1.5 1.3 1.2 5.9 38 4.9<br />
46.5 71.3 59.9 28 57.6<br />
70.8 56.7 63.9 15 55.8<br />
32.3 61.8 45.6 434.5 44 218.8<br />
0.5 0.8 0.7 1.3 23 1.3<br />
0.0 6.5 0.9 3.3 52 77.7<br />
0.0 0.0 0.0 0.0 24.0<br />
0.0 0.0 0.0 0.0 33.8<br />
Number of <strong>Health</strong> facilities and beds Clinic CHCs<br />
Mobile<br />
Service<br />
District<br />
Hospital<br />
Regional<br />
Hospital<br />
Provincial<br />
Tertiary<br />
Hospital<br />
Central<br />
Hospital<br />
Specialised<br />
Hospital<br />
Private<br />
Hospitals<br />
Number of public sector facilities (20<strong>07</strong>) and beds (2005) 9 1 3 0 0 0 0 1 298<br />
Number of private sector facilities and beds (20<strong>07</strong>) 1 43<br />
152<br />
Beds