DHB 2006/07 - Health Systems Trust
DHB 2006/07 - Health Systems Trust
DHB 2006/07 - Health Systems Trust

Create successful ePaper yourself
Turn your PDF publications into a flip-book with our unique Google optimized e-Paper software.
Section B: District and Province Profiles<br />
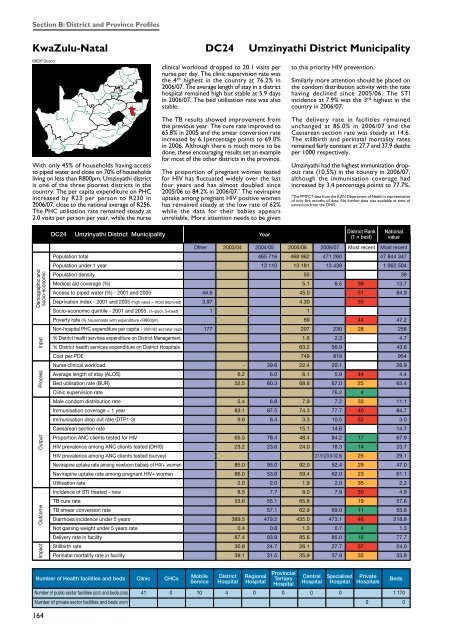
KwaZulu-Natal DC24 Umzinyathi District Municipality<br />
ISRDP District<br />
With only 45% of households having access<br />
to piped water and close on 70% of households<br />
living on less than R800pm, Umzinyathi district<br />
is one of the three poorest districts in the<br />
country. The per capita expenditure on PHC<br />
increased by R23 per person to R230 in<br />
<strong>2006</strong>/<strong>07</strong>, close to the national average of R256.<br />
The PHC utilisation rate remained steady at<br />
2.0 visits per person per year, while the nurse<br />
clinical workload dropped to 20.1 visits per<br />
nurse per day. The clinic supervision rate was<br />
the 4 th highest in the country at 76.2% in<br />
<strong>2006</strong>/<strong>07</strong>. The average length of stay in a district<br />
hospital remained high but stable at 5.9 days<br />
in <strong>2006</strong>/<strong>07</strong>. The bed utilisation rate was also<br />
stable.<br />
The TB results showed improvement from<br />
the previous year. The cure rate improved to<br />
65.8% in 2005 and the smear conversion rate<br />
increased by 6.1percentage points to 69.0%<br />
in <strong>2006</strong>. Although there is much more to be<br />
done, these encouraging results set an example<br />
for most of the other districts in the province.<br />
The proportion of pregnant women tested<br />
for HIV has fluctuated widely over the last<br />
four years and has almost doubled since<br />
2005/06 to 84.2% in <strong>2006</strong>/<strong>07</strong>. * The nevirapine<br />
uptake among pregnant HIV positive women<br />
has remained steady at the low rate of 62%<br />
while the data for their babies appears<br />
unreliable. More attention needs to be given<br />
to this priority HIV prevention.<br />
Similarly more attention should be placed on<br />
the condom distribution activity with the rate<br />
having declined since 2005/06. The STI<br />
incidence at 7.9% was the 3 rd highest in the<br />
country in <strong>2006</strong>/<strong>07</strong>.<br />
The delivery rate in facilities remained<br />
unchanged at 85.0% in <strong>2006</strong>/<strong>07</strong> and the<br />
Caesarean section rate was steady at 14.6.<br />
The stillbirth and perinatal mortality rates<br />
remained fairly constant at 27.7 and 37.9 deaths<br />
per 1000 respectively.<br />
Umzinyathi had the highest immunisation dropout<br />
rate (10.5%) in the country in <strong>2006</strong>/<strong>07</strong>,<br />
although the immunisation coverage had<br />
increased by 3.4 percentage points to 77.7%.<br />
*The PMTCT data from the KZN Department of <strong>Health</strong> is representative<br />
of only five months of data. No further data was available at time of<br />
extraction from the DHIS.<br />
DC24<br />
Umzinyathi District Municipality<br />
Year<br />
District Rank<br />
(1 = best)<br />
National<br />
value<br />
Demographic and<br />
socio-economic<br />
Impact Outcome Output Process Input<br />
465 716 468 962 471 260 47 844 347<br />
13 110 13 181 13 439 1 062 504<br />
55 39<br />
5.1 6.5 38 13.7<br />
44.6 45.0 51 84.9<br />
3.97 4.30 50<br />
1 1<br />
69 44 47.2<br />
177 2<strong>07</strong> 230 28 256<br />
1.6 2.3 4.7<br />
63.2 56.9 43.6<br />
749 819 954<br />
- 39.6 22.4 20.1 26.9<br />
6.2 6.0 6.1 5.9 44 4.4<br />
52.5 60.3 68.8 67.0 25 65.4<br />
76.2 4<br />
5.4 6.8 7.9 7.2 33 11.1<br />
83.1 87.5 74.3 77.7 40 84.7<br />
9.6 8.4 3.3 10.5 52 3.0<br />
15.1 14.6 14.7<br />
65.5 78.4 48.4 84.2 17 67.9<br />
23.2 23.6 24.0 18.3 14 23.7<br />
27.9 (23.0-32.8) 25 29.1<br />
85.0 95.0 92.0 52.4 29 47.0<br />
86.0 53.6 59.4 62.0 23 61.1<br />
2.0 2.0 1.9 2.0 35 2.2<br />
8.5 7.7 8.0 7.9 50 4.9<br />
53.6 55.1 65.8 19 57.6<br />
57.1 62.9 69.0 11 55.8<br />
389.5 479.2 435.0 473.1 46 218.8<br />
0.4 0.8 1.3 0.7 4 1.3<br />
87.4 83.9 85.6 85.0 16 77.7<br />
30.8 24.7 26.1 27.7 37 24.0<br />
39.1 31.5 35.9 37.9 35 33.8<br />
Number of <strong>Health</strong> facilities and beds Clinic CHCs<br />
Mobile<br />
Service<br />
District<br />
Hospital<br />
Regional<br />
Hospital<br />
Provincial<br />
Tertiary<br />
Hospital<br />
Central<br />
Hospital<br />
Specialised<br />
Hospital<br />
Private<br />
Hospitals<br />
Number of public sector facilities (20<strong>07</strong>) and beds (2005) 41 0 10 4 0 0 0 0 1 170<br />
Number of private sector facilities and beds (20<strong>07</strong>) 0 0<br />
164<br />
Beds