DHB 2006/07 - Health Systems Trust
DHB 2006/07 - Health Systems Trust
DHB 2006/07 - Health Systems Trust

You also want an ePaper? Increase the reach of your titles
YUMPU automatically turns print PDFs into web optimized ePapers that Google loves.
Section B: District and Province Profiles<br />
Gauteng JHB City of Johannesburg<br />
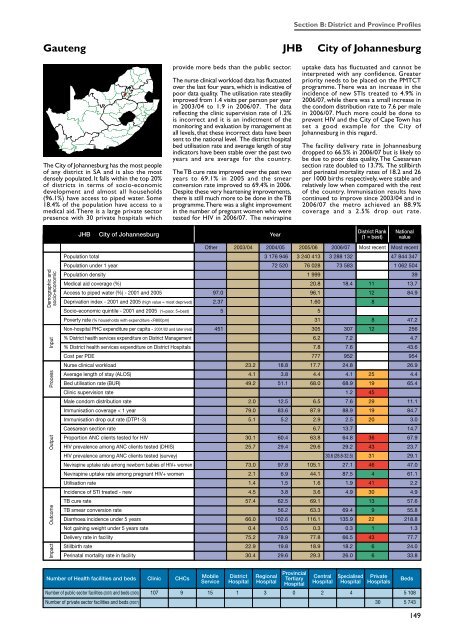
The City of Johannesburg has the most people<br />
of any district in SA and is also the most<br />
densely populated. It falls within the top 20%<br />
of districts in terms of socio-economic<br />
development and almost all households<br />
(96.1%) have access to piped water. Some<br />
18.4% of the population have access to a<br />
medical aid. There is a large private sector<br />
presence with 30 private hospitals which<br />
provide more beds than the public sector.<br />
The nurse clinical workload data has fluctuated<br />
over the last four years, which is indicative of<br />
poor data quality. The utilisation rate steadily<br />
improved from 1.4 visits per person per year<br />
in 2003/04 to 1.9 in <strong>2006</strong>/<strong>07</strong>. The data<br />
reflecting the clinic supervision rate of 1.2%<br />
is incorrect and it is an indictment of the<br />
monitoring and evaluation by management at<br />
all levels, that these incorrect data have been<br />
sent to the national level. The district hospital<br />
bed utilisation rate and average length of stay<br />
indicators have been stable over the past two<br />
years and are average for the country.<br />
The TB cure rate improved over the past two<br />
years to 69.1% in 2005 and the smear<br />
conversion rate improved to 69.4% in <strong>2006</strong>.<br />
Despite these very heartening improvements,<br />
there is still much more to be done in the TB<br />
programme. There was a slight improvement<br />
in the number of pregnant women who were<br />
tested for HIV in <strong>2006</strong>/<strong>07</strong>. The nevirapine<br />
uptake data has fluctuated and cannot be<br />
interpreted with any confidence. Greater<br />
priority needs to be placed on the PMTCT<br />
programme. There was an increase in the<br />
incidence of new STIs treated to 4.9% in<br />
<strong>2006</strong>/<strong>07</strong>, while there was a small increase in<br />
the condom distribution rate to 7.6 per male<br />
in <strong>2006</strong>/<strong>07</strong>. Much more could be done to<br />
prevent HIV and the City of Cape Town has<br />
set a good example for the City of<br />
Johannesburg in this regard.<br />
The facility delivery rate in Johannesburg<br />
dropped to 66.5% in <strong>2006</strong>/<strong>07</strong> but is likely to<br />
be due to poor data quality. The Caesarean<br />
section rate doubled to 13.7%. The stillbirth<br />
and perinatal mortality rates of 18.2 and 26<br />
per 1000 births respectively, were stable and<br />
relatively low when compared with the rest<br />
of the country. Immunisation results have<br />
continued to improve since 2003/04 and in<br />
<strong>2006</strong>/<strong>07</strong> the metro achieved an 88.9%<br />
coverage and a 2.5% drop out rate.<br />
JHB<br />
City of Johannesburg<br />
Year<br />
District Rank<br />
(1 = best)<br />
National<br />
value<br />
Demographic and<br />
socio-economic<br />
Impact Outcome Output Process Input<br />
3 176 946 3 240 413 3 288 132 47 844 347<br />
72 520 76 028 73 583 1 062 504<br />
1 999 39<br />
20.8 18.4 11 13.7<br />
97.0 96.1 12 84.9<br />
2.37 1.60 8<br />
5 5<br />
31 8 47.2<br />
451 305 3<strong>07</strong> 12 256<br />
6.2 7.2 4.7<br />
7.8 7.6 43.6<br />
777 952 954<br />
23.2 18.8 17.7 24.8 26.9<br />
4.1 3.8 4.4 4.1 25 4.4<br />
49.2 51.1 68.0 68.9 19 65.4<br />
1.2 45<br />
2.0 12.5 6.5 7.6 29 11.1<br />
79.0 83.6 87.9 88.9 19 84.7<br />
5.1 5.2 2.9 2.5 20 3.0<br />
6.7 13.7 14.7<br />
30.1 60.4 63.8 64.8 36 67.9<br />
25.7 29.4 29.6 29.2 43 23.7<br />
30.6 (28.8-32.5) 31 29.1<br />
73.0 97.8 105.1 27.1 46 47.0<br />
2.1 6.9 44.1 87.5 4 61.1<br />
1.4 1.5 1.6 1.9 41 2.2<br />
4.5 3.8 3.6 4.9 30 4.9<br />
57.4 62.5 69.1 13 57.6<br />
56.2 63.3 69.4 9 55.8<br />
66.0 102.6 116.1 135.9 22 218.8<br />
0.4 0.5 0.3 0.3 1 1.3<br />
75.2 78.9 77.8 66.5 43 77.7<br />
22.9 19.8 18.9 18.2 6 24.0<br />
30.4 29.6 29.3 26.0 6 33.8<br />
Number of <strong>Health</strong> facilities and beds Clinic CHCs<br />
Mobile<br />
Service<br />
District<br />
Hospital<br />
Regional<br />
Hospital<br />
Provincial<br />
Tertiary<br />
Hospital<br />
Central<br />
Hospital<br />
Specialised<br />
Hospital<br />
Private<br />
Hospitals<br />
Number of public sector facilities (20<strong>07</strong>) and beds (2005) 1<strong>07</strong> 9 15 1 3 0 2 4 5 108<br />
Number of private sector facilities and beds (20<strong>07</strong>) 30 5 743<br />
Beds<br />
149