DHB 2006/07 - Health Systems Trust
DHB 2006/07 - Health Systems Trust
DHB 2006/07 - Health Systems Trust

Create successful ePaper yourself
Turn your PDF publications into a flip-book with our unique Google optimized e-Paper software.
Section B: District and Province Profiles<br />
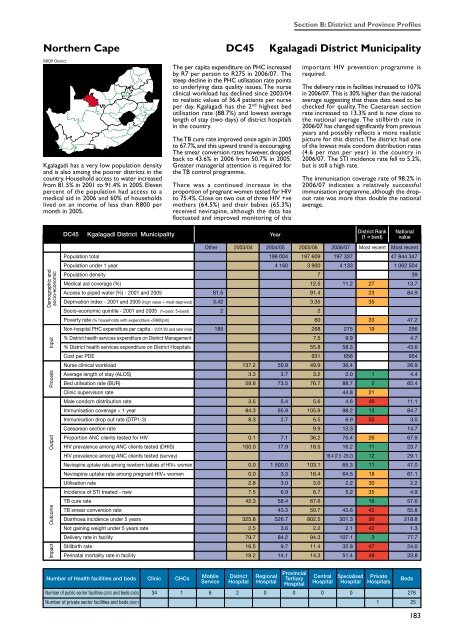
Northern Cape DC45 Kgalagadi District Municipality<br />
ISRDP District<br />
Kgalagadi has a very low population density<br />
and is also among the poorer districts in the<br />
country. Household access to water increased<br />
from 81.5% in 2001 to 91.4% in 2005. Eleven<br />
percent of the population had access to a<br />
medical aid in <strong>2006</strong> and 60% of households<br />
lived on an income of less than R800 per<br />
month in 2005.<br />
The per capita expenditure on PHC increased<br />
by R7 per person to R275 in <strong>2006</strong>/<strong>07</strong>. The<br />
steep decline in the PHC utilisation rate points<br />
to underlying data quality issues. The nurse<br />
clinical workload has declined since 2003/04<br />
to realistic values of 36.4 patients per nurse<br />
per day. Kgalagadi has the 2 nd highest bed<br />
utilisation rate (88.7%) and lowest average<br />
length of stay (two days) of district hospitals<br />
in the country.<br />
The TB cure rate improved once again in 2005<br />
to 67.7%, and this upward trend is encouraging.<br />
The smear conversion rates however, dropped<br />
back to 43.6% in <strong>2006</strong> from 50.7% in 2005.<br />
Greater managerial attention is required for<br />
the TB control programme.<br />
There was a continued increase in the<br />
proportion of pregnant women tested for HIV<br />
to 75.4%. Close on two out of three HIV +ve<br />
mothers (64.5%) and their babies (65.3%)<br />
received nevirapine, although the data has<br />
fluctuated and improved monitoring of this<br />
important HIV prevention programme is<br />
required.<br />
The delivery rate in facilities increased to 1<strong>07</strong>%<br />
in <strong>2006</strong>/<strong>07</strong>. This is 30% higher than the national<br />
average suggesting that these data need to be<br />
checked for quality. The Caesarean section<br />
rate increased to 13.3% and is now close to<br />
the national average. The stillbirth rate in<br />
<strong>2006</strong>/<strong>07</strong> has changed significantly from previous<br />
years and possibly reflects a more realistic<br />
picture for this district. The district had one<br />
of the lowest male condom distribution rates<br />
(4.6 per man per year) in the country in<br />
<strong>2006</strong>/<strong>07</strong>. The STI incidence rate fell to 5.2%,<br />
but is still a high rate.<br />
The immunisation coverage rate of 98.2% in<br />
<strong>2006</strong>/<strong>07</strong> indicates a relatively successful<br />
immunisation programme, although the dropout<br />
rate was more than double the national<br />
average.<br />
DC45<br />
Kgalagadi District Municipality<br />
Year<br />
District Rank<br />
(1 = best)<br />
National<br />
value<br />
Demographic and<br />
socio-economic<br />
Impact Outcome Output Process Input<br />
196 004 197 609 197 337 47 844 347<br />
4 160 3 900 4 133 1 062 504<br />
7 39<br />
12.5 11.2 27 13.7<br />
81.5 91.4 23 84.9<br />
3.42 3.35 35<br />
2 2<br />
60 33 47.2<br />
185 268 275 19 256<br />
7.5 9.9 4.7<br />
55.8 58.3 43.6<br />
631 656 954<br />
137.2 50.9 49.9 36.4 26.9<br />
3.3 3.7 3.2 2.0 1 4.4<br />
58.8 73.5 76.7 88.7 2 65.4<br />
44.8 21<br />
3.5 5.4 5.6 4.6 49 11.1<br />
84.3 95.9 105.9 98.2 13 84.7<br />
8.3 2.7 6.5 6.9 50 3.0<br />
9.9 13.3 14.7<br />
0.1 7.1 36.2 75.4 26 67.9<br />
100.0 17.9 18.5 16.2 11 23.7<br />
18.4 (7.5 -29.2) 12 29.1<br />
0.0 1 500.0 103.1 65.3 11 47.0<br />
0.0 3.3 16.4 64.5 18 61.1<br />
2.8 3.0 3.0 2.2 30 2.2<br />
7.5 6.9 6.7 5.2 35 4.9<br />
42.3 58.4 67.6 16 57.6<br />
43.3 50.7 43.6 42 55.8<br />
325.8 526.7 802.5 301.3 36 218.8<br />
2.5 3.6 2.2 2.1 42 1.3<br />
79.7 84.2 94.3 1<strong>07</strong>.1 3 77.7<br />
16.5 9.7 11.4 32.8 47 24.0<br />
19.2 14.1 14.3 51.4 48 33.8<br />
Number of <strong>Health</strong> facilities and beds Clinic CHCs<br />
Mobile<br />
Service<br />
District<br />
Hospital<br />
Regional<br />
Hospital<br />
Provincial<br />
Tertiary<br />
Hospital<br />
Central<br />
Hospital<br />
Specialised<br />
Hospital<br />
Private<br />
Hospitals<br />
Number of public sector facilities (20<strong>07</strong>) and beds (2005) 34 1 6 2 0 0 0 0 278<br />
Number of private sector facilities and beds (20<strong>07</strong>) 1 25<br />
Beds<br />
183