DHB 2006/07 - Health Systems Trust
DHB 2006/07 - Health Systems Trust
DHB 2006/07 - Health Systems Trust

You also want an ePaper? Increase the reach of your titles
YUMPU automatically turns print PDFs into web optimized ePapers that Google loves.
Section A: Indicator Comparisons by District<br />
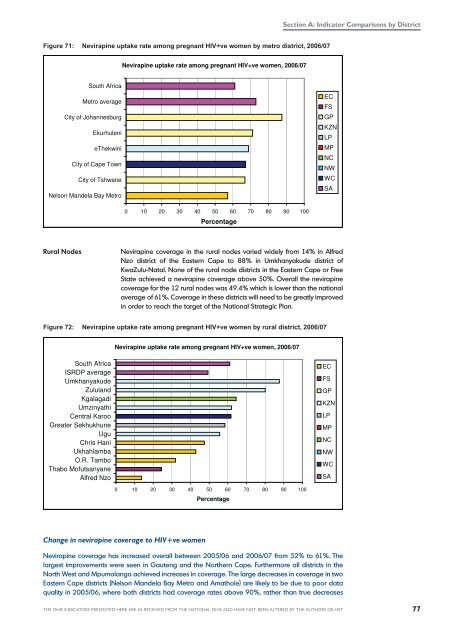
Figure 71: Nevirapine uptake rate among pregnant HIV+ve women by metro district, <strong>2006</strong>/<strong>07</strong><br />
Nevirapine uptake rate among pregnant HIV+ve women, <strong>2006</strong>/<strong>07</strong><br />
South Africa<br />
Metro average<br />
City of Johannesburg<br />
Ekurhuleni<br />
eThekwini<br />
City of Cape Town<br />
City of Tshwane<br />
Nelson Mandela Bay Metro<br />
EC<br />
FS<br />
GP<br />
KZN<br />
LP<br />
MP<br />
NC<br />
NW<br />
WC<br />
SA<br />
0 10 20 30 40 50 60 70 80 90 100<br />
Percentage<br />
Rural Nodes<br />
Nevirapine coverage in the rural nodes varied widely from 14% in Alfred<br />
Nzo district of the Eastern Cape to 88% in Umkhanyakude district of<br />
KwaZulu-Natal. None of the rural node districts in the Eastern Cape or Free<br />
State achieved a nevirapine coverage above 50%. Overall the nevirapine<br />
coverage for the 12 rural nodes was 49.4% which is lower than the national<br />
average of 61%. Coverage in these districts will need to be greatly improved<br />
in order to reach the target of the National Strategic Plan.<br />
Figure 72: Nevirapine uptake rate among pregnant HIV+ve women by rural district, <strong>2006</strong>/<strong>07</strong><br />
Nevirapine uptake rate among pregnant HIV+ve women, <strong>2006</strong>/<strong>07</strong><br />
South Africa<br />
ISRDP average<br />
Umkhanyakude<br />
Zululand<br />
Kgalagadi<br />
Umzinyathi<br />
Central Karoo<br />
Greater Sekhukhune<br />
Ugu<br />
Chris Hani<br />
Ukhahlamba<br />
O.R. Tambo<br />
Thabo Mofutsanyane<br />
Alfred Nzo<br />
EC<br />
FS<br />
GP<br />
KZN<br />
LP<br />
MP<br />
NC<br />
NW<br />
WC<br />
SA<br />
0 10 20 30 40 50 60 70 80 90 100<br />
Percentage<br />
Change in nevirapine coverage to HIV+ve women<br />
Nevirapine coverage has increased overall between 2005/06 and <strong>2006</strong>/<strong>07</strong> from 52% to 61%. The<br />
largest improvements were seen in Gauteng and the Northern Cape. Furthermore all districts in the<br />
North West and Mpumalanga achieved increases in coverage. The large decreases in coverage in two<br />
Eastern Cape districts (Nelson Mandela Bay Metro and Amathole) are likely to be due to poor data<br />
quality in 2005/06, where both districts had coverage rates above 90%, rather than true decreases<br />
THE DHIS INDICATORS PRESENTED HERE ARE AS RECEIVED FROM THE NATIONAL DHIS AND HAVE NOT BEEN ALTERED BY THE AUTHORS OR HST 77