DHB 2006/07 - Health Systems Trust
DHB 2006/07 - Health Systems Trust
DHB 2006/07 - Health Systems Trust

Create successful ePaper yourself
Turn your PDF publications into a flip-book with our unique Google optimized e-Paper software.
Section B: District and Province Profiles<br />
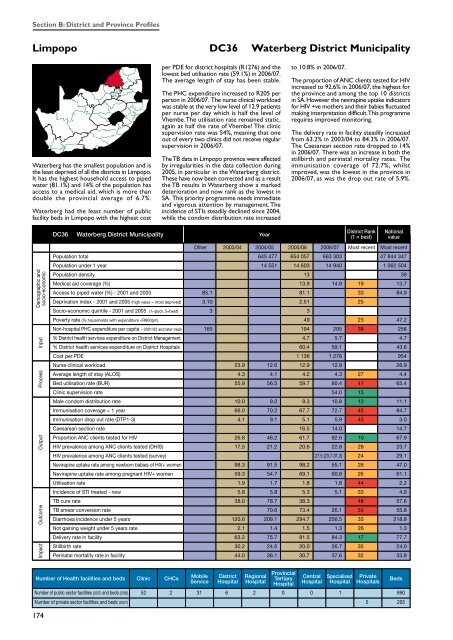
Limpopo DC36 Waterberg District Municipality<br />
Waterberg has the smallest population and is<br />
the least deprived of all the districts in Limpopo.<br />
It has the highest household access to piped<br />
water (81.1%) and 14% of the population has<br />
access to a medical aid, which is more than<br />
double the provincial average of 6.7%.<br />
Waterberg had the least number of public<br />
facility beds in Limpopo with the highest cost<br />
per PDE for district hospitals (R1276) and the<br />
lowest bed utilisation rate (59.1%) in <strong>2006</strong>/<strong>07</strong>.<br />
The average length of stay has been stable.<br />
The PHC expenditure increased to R205 per<br />
person in <strong>2006</strong>/<strong>07</strong>. The nurse clinical workload<br />
was stable at the very low level of 12.9 patients<br />
per nurse per day which is half the level of<br />
Vhembe. The utilisation rate remained static,<br />
again at half the rate of Vhembe! The clinic<br />
supervision rate was 54%, meaning that one<br />
out of every two clinics did not receive regular<br />
supervision in <strong>2006</strong>/<strong>07</strong>.<br />
The TB data in Limpopo province were affected<br />
by irregularities in the data collection during<br />
2005, in particular in the Waterberg district.<br />
These have now been corrected and as a result<br />
the TB results in Waterberg show a marked<br />
deterioration and now rank as the lowest in<br />
SA. This priority programme needs immediate<br />
and vigorous attention by management. The<br />
incidence of STIs steadily declined since 2004,<br />
while the condom distribution rate increased<br />
to 10.8% in <strong>2006</strong>/<strong>07</strong>.<br />
The proportion of ANC clients tested for HIV<br />
increased to 92.6% in <strong>2006</strong>/<strong>07</strong>, the highest for<br />
the province and among the top 10 districts<br />
in SA. However the nevirapine uptake indicators<br />
for HIV +ve mothers and their babies fluctuated<br />
making interpretation difficult. This programme<br />
requires improved monitoring.<br />
The delivery rate in facility steadily increased<br />
from 63.2% in 2003/04 to 84.3% in <strong>2006</strong>/<strong>07</strong>.<br />
The Caesarean section rate dropped to 14%<br />
in <strong>2006</strong>/<strong>07</strong>. There was an increase in both the<br />
stillbirth and perinatal mortality rates. The<br />
immunisation coverage of 72.7%, whilst<br />
improved, was the lowest in the province in<br />
<strong>2006</strong>/<strong>07</strong>, as was the drop out rate of 5.9%.<br />
DC36<br />
Waterberg District Municipality<br />
Year<br />
District Rank<br />
(1 = best)<br />
National<br />
value<br />
Demographic and<br />
socio-economic<br />
Impact Outcome Output Process Input<br />
645 477 654 057 663 303 47 844 347<br />
14 551 14 603 14 940 1 062 504<br />
13 39<br />
13.9 14.9 19 13.7<br />
85.1 81.1 33 84.9<br />
3.10 2.51 25<br />
3 3<br />
49 23 47.2<br />
165 194 205 38 256<br />
4.7 5.7 4.7<br />
60.4 59.1 43.6<br />
1 136 1 276 954<br />
23.9 12.6 12.9 12.9 26.9<br />
4.3 4.1 4.2 4.3 27 4.4<br />
55.9 56.5 59.7 60.4 41 65.4<br />
54.0 15<br />
10.0 9.2 9.3 10.8 12 11.1<br />
66.0 70.2 67.7 72.7 45 84.7<br />
4.1 9.1 5.1 5.9 45 3.0<br />
16.5 14.0 14.7<br />
26.8 46.2 61.7 92.6 10 67.9<br />
17.5 21.2 20.6 22.8 28 23.7<br />
27.5 (23.7-31.3) 24 29.1<br />
98.3 91.5 98.2 55.1 26 47.0<br />
59.3 54.7 69.1 60.8 26 61.1<br />
1.9 1.7 1.8 1.8 44 2.2<br />
5.8 5.8 5.3 5.1 33 4.9<br />
38.0 78.7 38.3 48 57.6<br />
70.6 73.4 26.1 53 55.8<br />
120.6 209.1 294.7 256.5 33 218.8<br />
2.1 1.4 1.5 1.3 26 1.3<br />
63.2 75.7 81.5 84.3 17 77.7<br />
30.2 24.5 20.0 26.7 35 24.0<br />
44.0 36.1 30.7 37.6 32 33.8<br />
Number of <strong>Health</strong> facilities and beds Clinic CHCs<br />
Mobile<br />
Service<br />
District<br />
Hospital<br />
Regional<br />
Hospital<br />
Provincial<br />
Tertiary<br />
Hospital<br />
Central<br />
Hospital<br />
Specialised<br />
Hospital<br />
Private<br />
Hospitals<br />
Number of public sector facilities (20<strong>07</strong>) and beds (2005) 52 2 31 6 2 0 0 1 890<br />
Number of private sector facilities and beds (20<strong>07</strong>) 5 205<br />
174<br />
Beds