DHB 2006/07 - Health Systems Trust
DHB 2006/07 - Health Systems Trust
DHB 2006/07 - Health Systems Trust
Create successful ePaper yourself
Turn your PDF publications into a flip-book with our unique Google optimized e-Paper software.
Section B: District and Province Profiles<br />
Free State<br />
Ross Haynes<br />
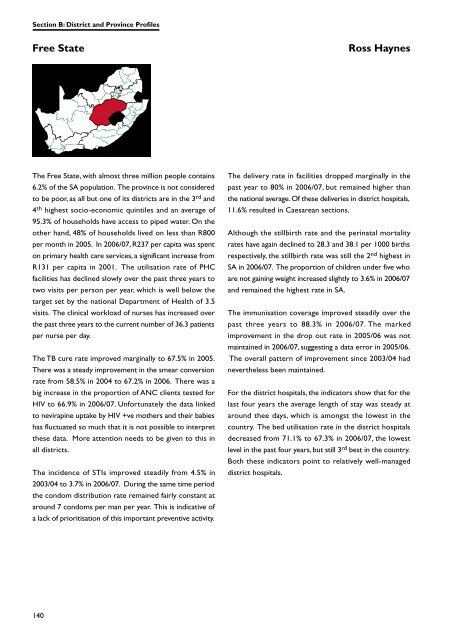
The Free State, with almost three million people contains<br />
6.2% of the SA population. The province is not considered<br />
to be poor, as all but one of its districts are in the 3 rd and<br />
4 th highest socio-economic quintiles and an average of<br />
95.3% of households have access to piped water. On the<br />
other hand, 48% of households lived on less than R800<br />
per month in 2005. In <strong>2006</strong>/<strong>07</strong>, R237 per capita was spent<br />
on primary health care services, a significant increase from<br />
R131 per capita in 2001. The utilisation rate of PHC<br />
facilities has declined slowly over the past three years to<br />
two visits per person per year, which is well below the<br />
target set by the national Department of <strong>Health</strong> of 3.5<br />
visits. The clinical workload of nurses has increased over<br />
the past three years to the current number of 36.3 patients<br />
per nurse per day.<br />
The TB cure rate improved marginally to 67.5% in 2005.<br />
There was a steady improvement in the smear conversion<br />
rate from 58.5% in 2004 to 67.2% in <strong>2006</strong>. There was a<br />
big increase in the proportion of ANC clients tested for<br />
HIV to 66.9% in <strong>2006</strong>/<strong>07</strong>. Unfortunately the data linked<br />
to nevirapine uptake by HIV +ve mothers and their babies<br />
has fluctuated so much that it is not possible to interpret<br />
these data. More attention needs to be given to this in<br />
all districts.<br />
The incidence of STIs improved steadily from 4.5% in<br />
2003/04 to 3.7% in <strong>2006</strong>/<strong>07</strong>. During the same time period<br />
the condom distribution rate remained fairly constant at<br />
around 7 condoms per man per year. This is indicative of<br />
a lack of prioritisation of this important preventive activity.<br />
The delivery rate in facilities dropped marginally in the<br />
past year to 80% in <strong>2006</strong>/<strong>07</strong>, but remained higher than<br />
the national average. Of these deliveries in district hospitals,<br />
11.6% resulted in Caesarean sections.<br />
Although the stillbirth rate and the perinatal mortality<br />
rates have again declined to 28.3 and 38.1 per 1000 births<br />
respectively, the stillbirth rate was still the 2 nd highest in<br />
SA in <strong>2006</strong>/<strong>07</strong>. The proportion of children under five who<br />
are not gaining weight increased slightly to 3.6% in <strong>2006</strong>/<strong>07</strong><br />
and remained the highest rate in SA.<br />
The immunisation coverage improved steadily over the<br />
past three years to 88.3% in <strong>2006</strong>/<strong>07</strong>. The marked<br />
improvement in the drop out rate in 2005/06 was not<br />
maintained in <strong>2006</strong>/<strong>07</strong>, suggesting a data error in 2005/06.<br />
The overall pattern of improvement since 2003/04 had<br />
nevertheless been maintained.<br />
For the district hospitals, the indicators show that for the<br />
last four years the average length of stay was steady at<br />
around thee days, which is amongst the lowest in the<br />
country. The bed utilisation rate in the district hospitals<br />
decreased from 71.1% to 67.3% in <strong>2006</strong>/<strong>07</strong>, the lowest<br />
level in the past four years, but still 3 rd best in the country.<br />
Both these indicators point to relatively well-managed<br />
district hospitals.<br />
140


