DHB 2006/07 - Health Systems Trust
DHB 2006/07 - Health Systems Trust
DHB 2006/07 - Health Systems Trust

You also want an ePaper? Increase the reach of your titles
YUMPU automatically turns print PDFs into web optimized ePapers that Google loves.
Section B: District and Province Profiles<br />
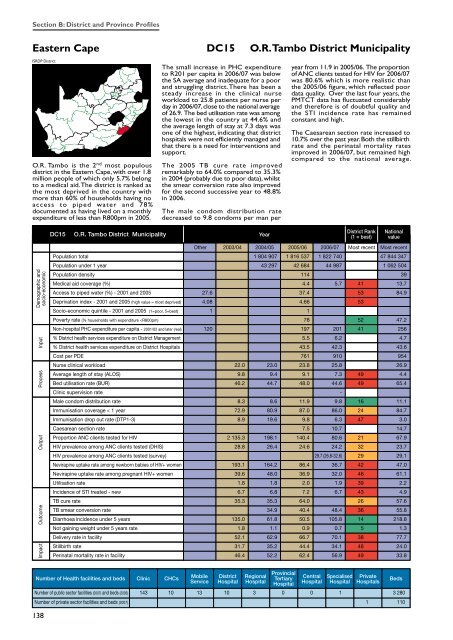
Eastern Cape DC15 O.R. Tambo District Municipality<br />
ISRDP District<br />
O.R. Tambo is the 2 nd most populous<br />
district in the Eastern Cape, with over 1.8<br />
million people of which only 5.7% belong<br />
to a medical aid. The district is ranked as<br />
the most deprived in the country with<br />
more than 60% of households having no<br />
access to piped water and 78%<br />
documented as having lived on a monthly<br />
expenditure of less than R800pm in 2005.<br />
The small increase in PHC expenditure<br />
to R201 per capita in <strong>2006</strong>/<strong>07</strong> was below<br />
the SA average and inadequate for a poor<br />
and struggling district. There has been a<br />
steady increase in the clinical nurse<br />
workload to 25.8 patients per nurse per<br />
day in <strong>2006</strong>/<strong>07</strong>, close to the national average<br />
of 26.9. The bed utilisation rate was among<br />
the lowest in the country at 44.6% and<br />
the average length of stay at 7.3 days was<br />
one of the highest, indicating that district<br />
hospitals were not efficiently managed and<br />
that there is a need for interventions and<br />
support.<br />
The 2005 TB cure rate improved<br />
remarkably to 64.0% compared to 35.3%<br />
in 2004 (probably due to poor data), whilst<br />
the smear conversion rate also improved<br />
for the second successive year to 48.8%<br />
in <strong>2006</strong>.<br />
The male condom distribution rate<br />
decreased to 9.8 condoms per man per<br />
year from 11.9 in 2005/06. The proportion<br />
of ANC clients tested for HIV for <strong>2006</strong>/<strong>07</strong><br />
was 80.6% which is more realistic than<br />
the 2005/06 figure, which reflected poor<br />
data quality. Over the last four years, the<br />
PMTCT data has fluctuated considerably<br />
and therefore is of doubtful quality and<br />
the STI incidence rate has remained<br />
constant and high.<br />
The Caesarean section rate increased to<br />
10.7% over the past year. Both the stillbirth<br />
rate and the perinatal mortality rates<br />
improved in <strong>2006</strong>/<strong>07</strong>, but remained high<br />
compared to the national average.<br />
DC15<br />
O.R. Tambo District Municipality<br />
Year<br />
District Rank<br />
(1 = best)<br />
National<br />
value<br />
Demographic and<br />
socio-economic<br />
Impact Outcome Output Process Input<br />
1 804 9<strong>07</strong> 1 816 537 1 822 740 47 844 347<br />
43 297 42 684 44 987 1 062 504<br />
114 39<br />
4.4 5.7 41 13.7<br />
27.6 37.4 53 84.9<br />
4.08 4.66 53<br />
1 1<br />
78 52 47.2<br />
120 197 201 41 256<br />
5.5 6.2 4.7<br />
43.5 42.3 43.6<br />
761 910 954<br />
22.0 23.0 23.8 25.8 26.9<br />
9.8 9.4 9.1 7.3 49 4.4<br />
46.2 44.7 48.0 44.6 49 65.4<br />
-<br />
8.3 8.6 11.9 9.8 16 11.1<br />
72.9 80.9 87.0 86.0 24 84.7<br />
8.9 19.6 9.8 6.3 47 3.0<br />
7.5 10.7 14.7<br />
2 135.3 198.1 140.4 80.6 21 67.9<br />
28.8 26.4 24.6 24.2 32 23.7<br />
29.7 (26.8-32.6) 29 29.1<br />
193.1 164.2 86.4 36.7 42 47.0<br />
39.6 48.0 36.9 32.0 46 61.1<br />
1.8 1.8 2.0 1.9 39 2.2<br />
6.7 6.8 7.2 6.7 43 4.9<br />
35.3 35.3 64.0 26 57.6<br />
34.9 40.4 48.4 36 55.8<br />
135.0 61.8 50.5 105.8 14 218.8<br />
1.8 1.1 0.9 0.7 5 1.3<br />
52.1 62.9 66.7 70.1 38 77.7<br />
31.7 35.2 44.4 34.1 48 24.0<br />
46.4 52.2 62.4 56.9 49 33.8<br />
Number of <strong>Health</strong> facilities and beds Clinic CHCs<br />
Mobile<br />
Service<br />
District<br />
Hospital<br />
Regional<br />
Hospital<br />
Provincial<br />
Tertiary<br />
Hospital<br />
Central<br />
Hospital<br />
Specialised<br />
Hospital<br />
Private<br />
Hospitals<br />
Number of public sector facilities (20<strong>07</strong>) and beds (2005) 143 10 13 10 3 0 0 1 3 280<br />
Number of private sector facilities and beds (20<strong>07</strong>) 1 110<br />
138<br />
Beds