DHB 2006/07 - Health Systems Trust
DHB 2006/07 - Health Systems Trust
DHB 2006/07 - Health Systems Trust

Create successful ePaper yourself
Turn your PDF publications into a flip-book with our unique Google optimized e-Paper software.
Section B: District and Province Profiles<br />
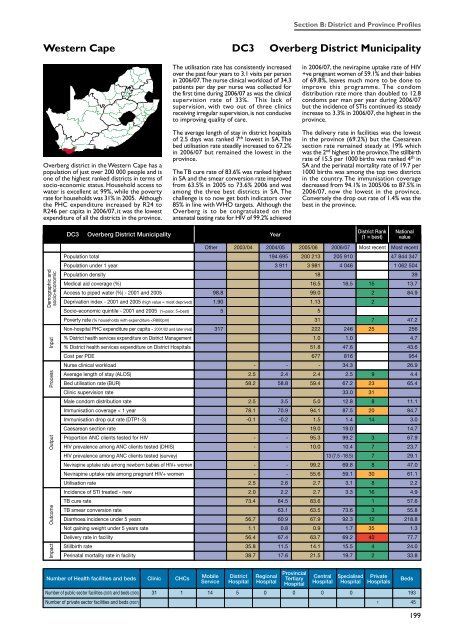
Western Cape DC3 Overberg District Municipality<br />
Overberg district in the Western Cape has a<br />
population of just over 200 000 people and is<br />
one of the highest ranked districts in terms of<br />
socio-economic status. Household access to<br />
water is excellent at 99%, while the poverty<br />
rate for households was 31% in 2005. Although<br />
the PHC expenditure increased by R24 to<br />
R246 per capita in <strong>2006</strong>/<strong>07</strong>, it was the lowest<br />
expenditure of all the districts in the province.<br />
The utilisation rate has consistently increased<br />
over the past four years to 3.1 visits per person<br />
in <strong>2006</strong>/<strong>07</strong>. The nurse clinical workload of 34.3<br />
patients per day per nurse was collected for<br />
the first time during <strong>2006</strong>/<strong>07</strong> as was the clinical<br />
supervision rate of 33%. This lack of<br />
supervision, with two out of three clinics<br />
receiving irregular supervision, is not conducive<br />
to improving quality of care.<br />
The average length of stay in district hospitals<br />
of 2.5 days was ranked 7 th lowest in SA. The<br />
bed utilisation rate steadily increased to 67.2%<br />
in <strong>2006</strong>/<strong>07</strong> but remained the lowest in the<br />
province.<br />
The TB cure rate of 83.6% was ranked highest<br />
in SA and the smear conversion rate improved<br />
from 63.5% in 2005 to 73.6% <strong>2006</strong> and was<br />
among the three best districts in SA. The<br />
challenge is to now get both indicators over<br />
85% in line with WHO targets. Although the<br />
Overberg is to be congratulated on the<br />
antenatal testing rate for HIV of 99.2% achieved<br />
in <strong>2006</strong>/<strong>07</strong>, the nevirapine uptake rate of HIV<br />
+ve pregnant women of 59.1% and their babies<br />
of 69.8%, leaves much more to be done to<br />
improve this programme. The condom<br />
distribution rate more than doubled to 12.8<br />
condoms per man per year during <strong>2006</strong>/<strong>07</strong><br />
but the incidence of STIs continued its steady<br />
increase to 3.3% in <strong>2006</strong>/<strong>07</strong>, the highest in the<br />
province.<br />
The delivery rate in facilities was the lowest<br />
in the province (69.2%) but the Caesarean<br />
section rate remained steady at 19% which<br />
was the 2 nd highest in the province. The stillbirth<br />
rate of 15.5 per 1000 births was ranked 4 th in<br />
SA and the perinatal mortality rate of 19.7 per<br />
1000 births was among the top two districts<br />
in the country. The immunisation coverage<br />
decreased from 94.1% in 2005/06 to 87.5% in<br />
<strong>2006</strong>/<strong>07</strong>, now the lowest in the province.<br />
Conversely the drop out rate of 1.4% was the<br />
best in the province.<br />
DC3<br />
Overberg District Municipality<br />
Year<br />
District Rank<br />
(1 = best)<br />
National<br />
value<br />
Demographic and<br />
socio-economic<br />
Impact Outcome Output Process Input<br />
194 695 200 213 205 910 47 844 347<br />
3 911 3 981 4 046 1 062 504<br />
18 39<br />
16.5 16.5 15 13.7<br />
98.8 99.0 2 84.9<br />
1.90 1.13 2<br />
5 5<br />
31 7 47.2<br />
317 222 246 25 256<br />
1.0 1.0 4.7<br />
51.8 47.6 43.6<br />
677 816 954<br />
- - - 34.3 26.9<br />
2.5 2.4 2.4 2.5 9 4.4<br />
58.2 58.8 59.4 67.2 23 65.4<br />
33.0 31<br />
2.5 3.5 5.0 12.8 8 11.1<br />
78.1 70.9 94.1 87.5 20 84.7<br />
-0.1 -0.2 1.5 1.4 14 3.0<br />
19.0 19.0 14.7<br />
- - 95.3 99.2 3 67.9<br />
- - 10.0 10.4 7 23.7<br />
13 (7.5 -18.5) 7 29.1<br />
- - 99.2 69.8 8 47.0<br />
- - 55.6 59.1 30 61.1<br />
2.5 2.6 2.7 3.1 8 2.2<br />
2.0 2.2 2.7 3.3 16 4.9<br />
73.4 84.5 83.6 1 57.6<br />
63.1 63.5 73.6 3 55.8<br />
56.7 60.9 67.9 92.3 12 218.8<br />
1.1 0.8 0.9 1.7 35 1.3<br />
56.4 67.4 63.7 69.2 40 77.7<br />
35.8 11.5 14.1 15.5 4 24.0<br />
38.7 17.6 21.5 19.7 2 33.8<br />
Number of <strong>Health</strong> facilities and beds Clinic CHCs<br />
Mobile<br />
Service<br />
District<br />
Hospital<br />
Regional<br />
Hospital<br />
Provincial<br />
Tertiary<br />
Hospital<br />
Central<br />
Hospital<br />
Specialised<br />
Hospital<br />
Private<br />
Hospitals<br />
Number of public sector facilities (20<strong>07</strong>) and beds (2005) 31 1 14 5 0 0 0 0 193<br />
Number of private sector facilities and beds (20<strong>07</strong>) 1 45<br />
Beds<br />
199