DHB 2006/07 - Health Systems Trust
DHB 2006/07 - Health Systems Trust
DHB 2006/07 - Health Systems Trust

You also want an ePaper? Increase the reach of your titles
YUMPU automatically turns print PDFs into web optimized ePapers that Google loves.
Section B: District and Province Profiles<br />
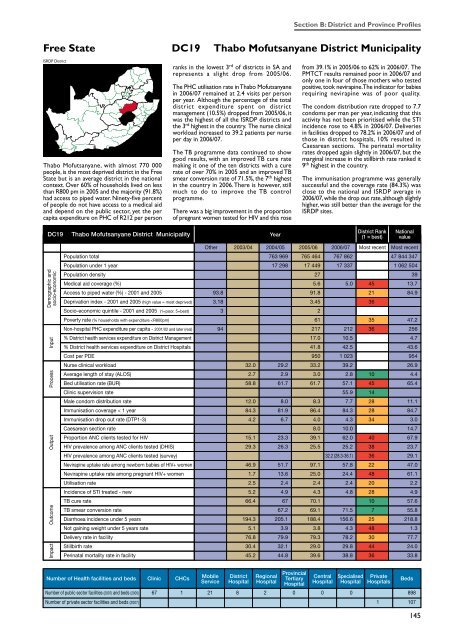
Free State DC19 Thabo Mofutsanyane District Municipality<br />
ISRDP District<br />
Thabo Mofutsanyane, with almost 770 000<br />
people, is the most deprived district in the Free<br />
State but is an average district in the national<br />
context. Over 60% of households lived on less<br />
than R800 pm in 2005 and the majority (91.8%)<br />
had access to piped water. Ninety-five percent<br />
of people do not have access to a medical aid<br />
and depend on the public sector, yet the per<br />
capita expenditure on PHC of R212 per person<br />
ranks in the lowest 3 rd of districts in SA and<br />
represents a slight drop from 2005/06.<br />
The PHC utilisation rate in Thabo Mofutsanyane<br />
in <strong>2006</strong>/<strong>07</strong> remained at 2.4 visits per person<br />
per year. Although the percentage of the total<br />
district expenditure spent on district<br />
management (10.5%) dropped from 2005/06, it<br />
was the highest of all the ISRDP districts and<br />
the 3 rd highest in the country. The nurse clinical<br />
workload increased to 39.2 patients per nurse<br />
per day in <strong>2006</strong>/<strong>07</strong>.<br />
The TB programme data continued to show<br />
good results, with an improved TB cure rate<br />
making it one of the ten districts with a cure<br />
rate of over 70% in 2005 and an improved TB<br />
smear conversion rate of 71.5%, the 7 th highest<br />
in the country in <strong>2006</strong>. There is however, still<br />
much to do to improve the TB control<br />
programme.<br />
There was a big improvement in the proportion<br />
of pregnant women tested for HIV and this rose<br />
from 39.1% in 2005/06 to 62% in <strong>2006</strong>/<strong>07</strong>. The<br />
PMTCT results remained poor in <strong>2006</strong>/<strong>07</strong> and<br />
only one in four of those mothers who tested<br />
positive, took nevirapine. The indicator for babies<br />
requiring nevirapine was of poor quality.<br />
The condom distribution rate dropped to 7.7<br />
condoms per man per year, indicating that this<br />
activity has not been prioritised while the STI<br />
incidence rose to 4.8% in <strong>2006</strong>/<strong>07</strong>. Deliveries<br />
in facilities dropped to 78.2% in <strong>2006</strong>/<strong>07</strong> and of<br />
those in district hospitals, 10% resulted in<br />
Caesarean sections. The perinatal mortality<br />
rates dropped again slightly in <strong>2006</strong>/<strong>07</strong>, but the<br />
marginal increase in the stillbirth rate ranked it<br />
9 th highest in the country.<br />
The immunisation programme was generally<br />
successful and the coverage rate (84.3%) was<br />
close to the national and ISRDP average in<br />
<strong>2006</strong>/<strong>07</strong>, while the drop out rate, although slightly<br />
higher, was still better than the average for the<br />
ISRDP sites.<br />
DC19<br />
Thabo Mofutsanyane District Municipality<br />
Year<br />
District Rank<br />
(1 = best)<br />
National<br />
value<br />
Demographic and<br />
socio-economic<br />
Impact Outcome Output Process Input<br />
763 969 765 464 767 862 47 844 347<br />
17 298 17 449 17 337 1 062 504<br />
27 39<br />
5.6 5.0 45 13.7<br />
93.8 91.8 21 84.9<br />
3.18 3.45 36<br />
3 2<br />
61 35 47.2<br />
94 217 212 36 256<br />
17.0 10.5 4.7<br />
41.8 42.5 43.6<br />
950 1 023 954<br />
32.0 29.2 33.2 39.2 26.9<br />
2.7 2.9 3.0 2.8 10 4.4<br />
58.8 61.7 61.7 57.1 45 65.4<br />
55.9 14<br />
12.0 8.0 8.3 7.7 28 11.1<br />
84.3 81.9 86.4 84.3 28 84.7<br />
4.2 6.7 4.0 4.3 34 3.0<br />
8.0 10.0 14.7<br />
15.1 23.3 39.1 62.0 40 67.9<br />
29.3 26.3 25.5 25.2 38 23.7<br />
32.2 (28.3-36.1) 36 29.1<br />
46.9 51.7 97.1 57.8 22 47.0<br />
1.7 13.6 25.0 24.4 48 61.1<br />
2.5 2.4 2.4 2.4 20 2.2<br />
5.2 4.9 4.3 4.8 28 4.9<br />
66.4 67 70.1 10 57.6<br />
67.2 69.1 71.5 7 55.8<br />
194.3 205.1 188.4 156.6 25 218.8<br />
5.1 3.9 3.8 4.3 48 1.3<br />
76.8 79.9 79.3 78.2 30 77.7<br />
30.4 32.1 29.0 29.8 44 24.0<br />
45.2 44.8 39.6 38.8 36 33.8<br />
Number of <strong>Health</strong> facilities and beds Clinic CHCs<br />
Mobile<br />
Service<br />
District<br />
Hospital<br />
Regional<br />
Hospital<br />
Provincial<br />
Tertiary<br />
Hospital<br />
Central<br />
Hospital<br />
Specialised<br />
Hospital<br />
Private<br />
Hospitals<br />
Number of public sector facilities (20<strong>07</strong>) and beds (2005) 67 1 21 8 2 0 0 0 898<br />
Number of private sector facilities and beds (20<strong>07</strong>) 1 1<strong>07</strong><br />
Beds<br />
145