DHB 2006/07 - Health Systems Trust
DHB 2006/07 - Health Systems Trust
DHB 2006/07 - Health Systems Trust

You also want an ePaper? Increase the reach of your titles
YUMPU automatically turns print PDFs into web optimized ePapers that Google loves.
Section A: Indicator Comparisons by District<br />
Table 2: Non-Hospital PHC expenditure per capita by province, <strong>2006</strong>/<strong>07</strong><br />
Code<br />
District<br />
PR2 Non-hospital<br />
PHC expenditure<br />
Local government<br />
expenditure<br />
Uninsured<br />
population<br />
Per capita<br />
expenditure<br />
EC Eastern Cape 1 405 944 922 59 864 090 6 332 283 231<br />
FS Free State 566 569 015 30 095 826 2 520 825 237<br />
GP Gauteng 1 417 584 732 768 105 135 7 660 725 285<br />
KZN KwaZulu-Natal 1 886 898 410 283 719 023 8 680 866 250<br />
LP Limpopo 945 387 951 31 <strong>07</strong>1 667 4 932 873 198<br />
MP Mpumalanga 558 385 687 43 652 145 3 193 802 189<br />
NC Northern Cape 247 331 489 9 576 016 949 638 271<br />
NW North West 798 031 795 35 197 735 2 703 569 308<br />
WC Western Cape 1 149 697 637 216 230 484 3 853 324 354<br />
ZA South Africa 8 975 831 638 1 477 512 121 40 898 482 256<br />
ISRDP ISRDP average 1 696 899 017 15 182 912 7 848 929 218<br />
Metro Metro average 2 578 410 940 1 195 606 381 12 044 466 313<br />
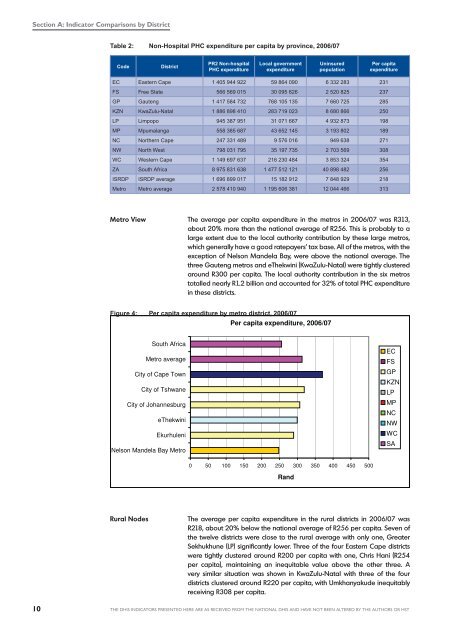
Metro View The average per capita expenditure in the metros in <strong>2006</strong>/<strong>07</strong> was R313,<br />
about 20% more than the national average of R256. This is probably to a<br />
large extent due to the local authority contribution by these large metros,<br />
which generally have a good ratepayers’ tax base. All of the metros, with the<br />
exception of Nelson Mandela Bay, were above the national average. The<br />
three Gauteng metros and eThekwini (KwaZulu-Natal) were tightly clustered<br />
around R300 per capita. The local authority contribution in the six metros<br />
totalled nearly R1.2 billion and accounted for 32% of total PHC expenditure<br />
in these districts.<br />
Figure 4: Per capita expenditure by metro district, <strong>2006</strong>/<strong>07</strong><br />
Per capita expenditure, <strong>2006</strong>/<strong>07</strong><br />
South Africa<br />
Metro average<br />
City of Cape Town<br />
City of Tshwane<br />
City of Johannesburg<br />
eThekwini<br />
Ekurhuleni<br />
Nelson Mandela Bay Metro<br />
EC<br />
FS<br />
GP<br />
KZN<br />
LP<br />
MP<br />
NC<br />
NW<br />
WC<br />
SA<br />
0 50 100 150 200 250 300 350 400 450 500<br />
Rand<br />
Rural Nodes<br />
The average per capita expenditure in the rural districts in <strong>2006</strong>/<strong>07</strong> was<br />
R218, about 20% below the national average of R256 per capita. Seven of<br />
the twelve districts were close to the rural average with only one, Greater<br />
Sekhukhune (LP) significantly lower. Three of the four Eastern Cape districts<br />
were tightly clustered around R200 per capita with one, Chris Hani (R254<br />
per capita), maintaining an inequitable value above the other three. A<br />
very similar situation was shown in KwaZulu-Natal with three of the four<br />
districts clustered around R220 per capita, with Umkhanyakude inequitably<br />
receiving R308 per capita.<br />
10<br />
THE DHIS INDICATORS PRESENTED HERE ARE AS RECEIVED FROM THE NATIONAL DHIS AND HAVE NOT BEEN ALTERED BY THE AUTHORS OR HST