DHB 2006/07 - Health Systems Trust
DHB 2006/07 - Health Systems Trust
DHB 2006/07 - Health Systems Trust

Create successful ePaper yourself
Turn your PDF publications into a flip-book with our unique Google optimized e-Paper software.
Section B: District and Province Profiles<br />
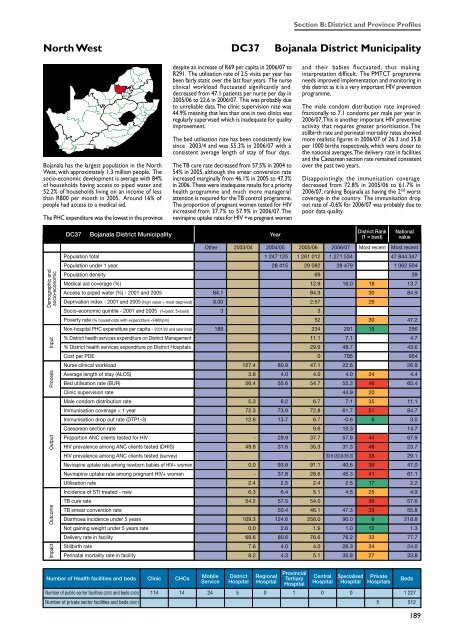
North West DC37 Bojanala District Municipality<br />
Bojanala has the largest population in the North<br />
West, with approximately 1.3 million people. The<br />
socio-economic development is average with 84%<br />
of households having access to piped water and<br />
52.2% of households living on an income of less<br />
than R800 per month in 2005. Around 16% of<br />
people had access to a medical aid.<br />
The PHC expenditure was the lowest in the province<br />
despite an increase of R69 per capita in <strong>2006</strong>/<strong>07</strong> to<br />
R291. The utilisation rate of 2.5 visits per year has<br />
been fairly static over the last four years. The nurse<br />
clinical workload fluctuated significantly and<br />
decreased from 47.1 patients per nurse per day in<br />
2005/06 to 22.6 in <strong>2006</strong>/<strong>07</strong>. This was probably due<br />
to unreliable data. The clinic supervision rate was<br />
44.9% meaning that less than one in two clinics was<br />
regularly supervised which is inadequate for quality<br />
improvement.<br />
The bed utilisation rate has been consistently low<br />
since 2003/4 and was 55.3% in <strong>2006</strong>/<strong>07</strong> with a<br />
consistent average length of stay of four days.<br />
The TB cure rate decreased from 57.5% in 2004 to<br />
54% in 2005, although the smear conversion rate<br />
increased marginally from 46.1% in 2005 to 47.3%<br />
in <strong>2006</strong>. These were inadequate results for a priority<br />
health programme and much more managerial<br />
attention is required for the TB control programme.<br />
The proportion of pregnant women tested for HIV<br />
increased from 37.7% to 57.9% in <strong>2006</strong>/<strong>07</strong>. The<br />
nevirapine uptake rates for HIV +ve pregnant women<br />
and their babies fluctuated, thus making<br />
interpretation difficult. The PMTCT programme<br />
needs improved implementation and monitoring in<br />
this district as it is a very important HIV prevention<br />
programme.<br />
The male condom distribution rate improved<br />
fractionally to 7.1 condoms per male per year in<br />
<strong>2006</strong>/<strong>07</strong>. This is another important HIV preventive<br />
activity that requires greater prioritisation. The<br />
stillbirth rate and perinatal mortality rates showed<br />
more realistic figures in <strong>2006</strong>/<strong>07</strong> of 26.3 and 35.8<br />
per 1000 births respectively, which were closer to<br />
the national averages. The delivery rate in facilities<br />
and the Caesarean section rate remained consistent<br />
over the past two years.<br />
Disappointingly, the immunisation coverage<br />
decreased from 72.8% in 2005/06 to 61.7% in<br />
<strong>2006</strong>/<strong>07</strong>, ranking Bojanala as having the 2 nd worst<br />
coverage in the country. The immunisation drop<br />
out rate of -0.6% for <strong>2006</strong>/<strong>07</strong> was probably due to<br />
poor data quality.<br />
DC37<br />
Bojanala District Municipality<br />
Year<br />
District Rank<br />
(1 = best)<br />
National<br />
value<br />
Demographic and<br />
socio-economic<br />
Impact Outcome Output Process Input<br />
1 247 125 1 261 012 1 271 534 47 844 347<br />
28 415 29 082 28 479 1 062 504<br />
69 39<br />
12.9 16.0 18 13.7<br />
84.1 84.3 30 84.9<br />
3.00 2.57 26<br />
3 3<br />
52 30 47.2<br />
189 234 291 15 256<br />
11.1 7.1 4.7<br />
29.9 48.7 43.6<br />
0 795 954<br />
127.4 80.9 47.1 22.6 26.9<br />
3.8 4.0 4.0 4.0 24 4.4<br />
56.4 55.6 54.7 55.3 46 65.4<br />
44.9 20<br />
5.3 6.2 6.7 7.1 35 11.1<br />
72.3 73.9 72.8 61.7 51 84.7<br />
12.6 13.7 6.7 -0.6 6 3.0<br />
9.6 10.3 14.7<br />
- 29.9 37.7 57.9 44 67.9<br />
49.8 31.6 35.3 31.3 48 23.7<br />
33.6 (30.9-36.3) 38 29.1<br />
0.0 93.8 91.1 40.6 39 47.0<br />
- 37.8 28.6 45.3 41 61.1<br />
2.4 2.5 2.4 2.5 17 2.2<br />
6.3 6.4 5.1 4.5 25 4.9<br />
54.2 57.5 54.0 36 57.6<br />
50.4 46.1 47.3 39 55.8<br />
109.3 124.6 258.0 90.0 9 218.8<br />
0.0 2.6 1.9 1.0 12 1.3<br />
69.6 80.6 76.6 76.2 33 77.7<br />
7.6 4.0 4.0 26.3 34 24.0<br />
8.2 4.3 5.1 35.8 27 33.8<br />
Number of <strong>Health</strong> facilities and beds Clinic CHCs<br />
Mobile<br />
Service<br />
District<br />
Hospital<br />
Regional<br />
Hospital<br />
Provincial<br />
Tertiary<br />
Hospital<br />
Central<br />
Hospital<br />
Specialised<br />
Hospital<br />
Private<br />
Hospitals<br />
Number of public sector facilities (20<strong>07</strong>) and beds (2005) 114 14 24 5 0 1 0 0 1 227<br />
Number of private sector facilities and beds (20<strong>07</strong>) 5 512<br />
Beds<br />
189