Report No xxxx - Instytut Fizyki JÄ drowej PAN
Report No xxxx - Instytut Fizyki JÄ drowej PAN
Report No xxxx - Instytut Fizyki JÄ drowej PAN

Create successful ePaper yourself
Turn your PDF publications into a flip-book with our unique Google optimized e-Paper software.
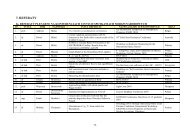
The method was experimentally verified with clay specimen on 200 MHz<br />
MR tomograph in ISI AS Brno. Reference substance giving the MR signal was water<br />
(χ H2O = -9.04·10 -6 ) filled into cube vessel. The field echo method with echotime T E = 5.56 ms<br />
[3] was used to acquire MR image with contrast corresponding to the magnetic field<br />
inhomogeneity. Experiment was treated one time with clay specimen of 7 mm thickness<br />
(Fig. 3A) and next only with water reference (Fig. 3B); basic field has magnetic induction<br />
B 0 = 4.7 T. Position of the specimen is depicted in Fig. 3A. Obtained image with phasecontrast<br />
was processed in Matlab. After de-noising by the limitation of signal the spatial<br />
deformation evoked by magnetic field inhomogeneity in specimen vicinity was eliminated.<br />
Acquired phase images were consequently subtracted to eliminate inhomogeneity of the basic<br />
field - Fig. 3C. By properly selected slice of this image we have the curve of phase change ∆Θ<br />
of the water MR signal in the specimen vicinity, Fig. 3D. For the used MR technique the<br />
phase change ∆Θ = 2π rad response to magnetic induction change ∆Θ , where γ is<br />
B 0<br />
∆ =<br />
γ ⋅T E<br />
gyromagnetic ratio of water. In this way we can identify the course of magnetic induction<br />
change in water nearby the clay specimen.<br />
Fig. 3. Images obtain from MR experiment with 7 mm thick clay specimen placed<br />
on water filled vessel 40×35 mm. Processed in Matlab.<br />
From known thickness x 0 of the specimen and measured area ∆B 0 from, the<br />
susceptibility of clay specimen was finally calculated<br />
B B − ∆B0 ⋅dx<br />
-6<br />
S<br />
−<br />
0 ∫ 2. 656⋅10<br />
χS<br />
= = = = 8.07 ⋅10<br />
-3<br />
B B ⋅∆x<br />
4.7 ⋅7 ⋅10<br />
0 0<br />
Conclusion:<br />
The method designed for magnetic susceptibility measurement based on MRI<br />
tomography techniques is simple and enables to determine the magnetic susceptibility of such<br />
materials, which give no MR signal. After an optimization this method can be used for<br />
investigation of the materials used in MR tomography as well as of biological tissues<br />
affecting quality of MR images. The paper was prepared within the framework of<br />
N°IAA2065201 project of the Grant Agency of the Academy of Sciences of the Czech<br />
Republic and with the support of the grant agency of Czech Republic 103/03/Z048.<br />
[1] Starčuk jr., Z.: NMR-compatibility of the dental alloy, ISI AS CR, Brno 2003<br />
[2] Zeman, V.: Magnetic susceptibility measurement by NMR. Tesla Brno, 1981<br />
[3] Blumlich B.: NMR Imaging of Materials. Clarenton Press, Oxford, 2000<br />
-5<br />
.<br />
80