The Local Agenda 21 Planning Guide - Democrats Against UN ...
The Local Agenda 21 Planning Guide - Democrats Against UN ...
The Local Agenda 21 Planning Guide - Democrats Against UN ...

Create successful ePaper yourself
Turn your PDF publications into a flip-book with our unique Google optimized e-Paper software.
<strong>The</strong> <strong>Local</strong> <strong>Agenda</strong> <strong>21</strong> <strong>Planning</strong> <strong>Guide</strong><br />
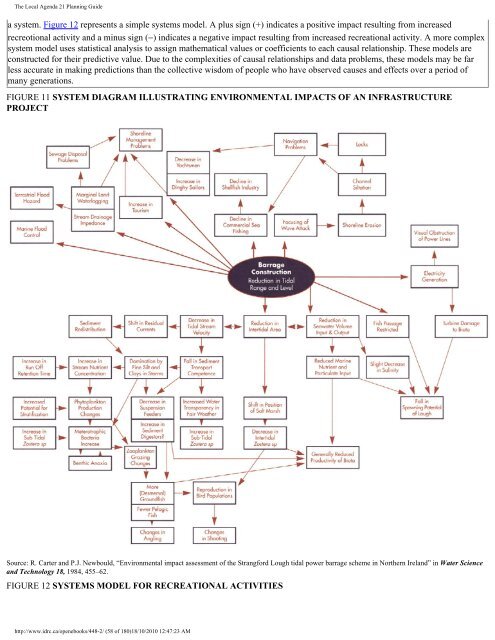
a system. Figure 12 represents a simple systems model. A plus sign (+) indicates a positive impact resulting from increased<br />
recreotional activity and a minus sign (−) indicates a negative impact resulting from increased recreational activity. A more complex<br />
system model uses statistical analysis to assign mathematical values or coefficients to each causal relationship. <strong>The</strong>se models are<br />
constructed for their predictive value. Due to the complexities of causal relationships and data problems, these models may be far<br />
less accurate in making predictions than the collective wisdom of people who have observed causes and effects over a period of<br />
many generations.<br />
FIGURE 11 SYSTEM DIAGRAM ILLUSTRATING ENVIRONMENTAL IMPACTS OF AN INFRASTRUCTURE<br />
PROJECT<br />
Source: R. Carter and P.J. Newbould, “Environmental impact assessment of the Strangford Lough tidal power barrage scheme in Northern Ireland” in Water Science<br />
and Technology 18, 1984, 455–62.<br />
FIGURE 12 SYSTEMS MODEL FOR RECREATIONAL ACTIVITIES<br />
http://www.idrc.ca/openebooks/448-2/ (58 of 180)18/10/2010 12:47:23 AM