Preventive Action for Refugee Producing Situations
Preventive Action for Refugee Producing Situations
Preventive Action for Refugee Producing Situations

You also want an ePaper? Increase the reach of your titles
YUMPU automatically turns print PDFs into web optimized ePapers that Google loves.
229<br />
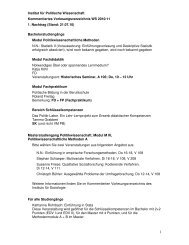
Evolution of Indicative Numbers of Asylum-Seekers EC<br />
Member States from I January 1980 to 31 December 1991<br />
Years Belgium Denmark Germany France Greece Italy Netherland<br />
s<br />
Portugal Spain U.<br />
Kingdom<br />
Total<br />
1991 13,750 4,600 256,100 45,900 2,650 23,300 21,600 250 7,250 44,750 420,150<br />
1990 12,950 5,300 193,050 49,750 6,200 4,750 21,200 100 6,850 25,250 325.400<br />
1989 8,100 4,600 121,300 58,750 3,000 2,250 13,900 150 2,850 15,550 230,450<br />
1988 5,100 4,650 103.100 31.700 8.400 1 ,300 7.500 350 3,300 5,250 170,650<br />
1987 6,000 2,750 57,400 24,900 6,950 11,050 13,450 450 2,500 5,150 130,600<br />
1986 7,650 9,300 99,650 23,500 4,250 6,500 5,850 250 2,300 4,800 164,050<br />
1985 5,300 8,700 73,850 25,8(X) 1,400 5,400 5,650 100 2,350 5,450 134,000<br />
1984 3,650 4,300 35,300 16,000 750 4,550 2,600 400 1,100 3,850 72,500<br />
1983 2,900 800 19,700 14,950 450 3,050 2,000 1,500 1,400 4,300 51,050<br />
1982 2,900 100 37.200 12,600 1,200 3,150 1,800 na 2,450 4,200 65,600<br />
1981 2,4(X) 100 49.400 9,200 2,250 3,600 I.600 na na 2,400 70,950<br />
1980 2,700 50 107,800 13.700 1,800 7.450 3,700 na na 9,950 147,150<br />
Total 73,400 45.250 1.153,850 326,750 39,300 76,350 1 00,850 3,550 32,350 130,900 1,982,550<br />
na = not available<br />
(Figures <strong>for</strong> Luxembourg and Ireland not available)<br />
Source: UNHCR Office <strong>for</strong> the European Institutions, Brussels, October 1992.