Ground-water development in East St. Louis area, Illinois. Urbana, IL ...
Ground-water development in East St. Louis area, Illinois. Urbana, IL ...
Ground-water development in East St. Louis area, Illinois. Urbana, IL ...

You also want an ePaper? Increase the reach of your titles
YUMPU automatically turns print PDFs into web optimized ePapers that Google loves.
at <strong>St</strong>. <strong>Louis</strong> was 421.26 feet and occurred on June 27,<br />
1844; the elevation of the m<strong>in</strong>imum stage was 373.33 feet<br />
on January 16, 1940.<br />
Table 4.<br />
Overflow from Missouri River<br />
Maximum<br />
Overflow for period Date of Overflow<br />
Period (ac-ft) occurrence (cfs)<br />
May 21-June 4, 1943 1,075,000 May 24, 1943 90,000<br />
April 29-May 13, 1944 891,000 April 30, 1944 90,000<br />
June 29-July 19, 1947 687,000 July 2, 1947 65,000<br />
July 5-31, 1951 2,534,000 July 20, 1951 110,000<br />
Climate<br />
The <strong>East</strong> <strong>St</strong>. <strong>Louis</strong> <strong>area</strong> lies <strong>in</strong> the north temperate<br />
zone. Its climate is characterized by warm summers and<br />
moderately cold w<strong>in</strong>ters.<br />
Accord<strong>in</strong>g to the Atlas of Ill<strong>in</strong>ois Resources, Section<br />
1 (1958), the average annual precipitation <strong>in</strong> the <strong>East</strong> <strong>St</strong>.<br />
<strong>Louis</strong> <strong>area</strong> is about 38 <strong>in</strong>ches. Precipitation has been<br />
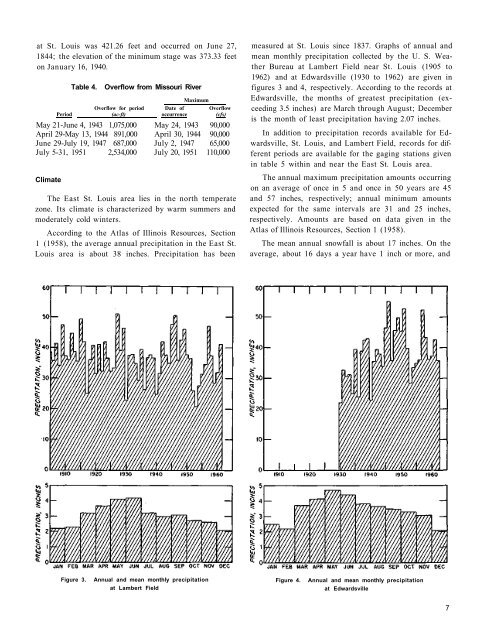
measured at <strong>St</strong>. <strong>Louis</strong> s<strong>in</strong>ce 1837. Graphs of annual and<br />
mean monthly precipitation collected by the U. S. Weather<br />
Bureau at Lambert Field near <strong>St</strong>. <strong>Louis</strong> (1905 to<br />
1962) and at Edwardsville (1930 to 1962) are given <strong>in</strong><br />
figures 3 and 4, respectively. Accord<strong>in</strong>g to the records at<br />
Edwardsville, the months of greatest precipitation (exceed<strong>in</strong>g<br />
3.5 <strong>in</strong>ches) are March through August; December<br />
is the month of least precipitation hav<strong>in</strong>g 2.07 <strong>in</strong>ches.<br />
In addition to precipitation records available for Edwardsville,<br />
<strong>St</strong>. <strong>Louis</strong>, and Lambert Field, records for different<br />
periods are available for the gag<strong>in</strong>g stations given<br />
<strong>in</strong> table 5 with<strong>in</strong> and near the <strong>East</strong> <strong>St</strong>. <strong>Louis</strong> <strong>area</strong>.<br />
The annual maximum precipitation amounts occurr<strong>in</strong>g<br />
on an average of once <strong>in</strong> 5 and once <strong>in</strong> 50 years are 45<br />
and 57 <strong>in</strong>ches, respectively; annual m<strong>in</strong>imum amounts<br />
expected for the same <strong>in</strong>tervals are 31 and 25 <strong>in</strong>ches,<br />
respectively. Amounts are based on data given <strong>in</strong> the<br />
Atlas of Ill<strong>in</strong>ois Resources, Section 1 (1958).<br />
The mean annual snowfall is about 17 <strong>in</strong>ches. On the<br />
average, about 16 days a year have 1 <strong>in</strong>ch or more, and<br />
Figure 3.<br />
Annual and mean monthly precipitation<br />
at Lambert Field<br />
Figure 4.<br />
Annual and mean monthly precipitation<br />
at Edwardsville<br />
7