Ground-water development in East St. Louis area, Illinois. Urbana, IL ...
Ground-water development in East St. Louis area, Illinois. Urbana, IL ...
Ground-water development in East St. Louis area, Illinois. Urbana, IL ...

You also want an ePaper? Increase the reach of your titles
YUMPU automatically turns print PDFs into web optimized ePapers that Google loves.
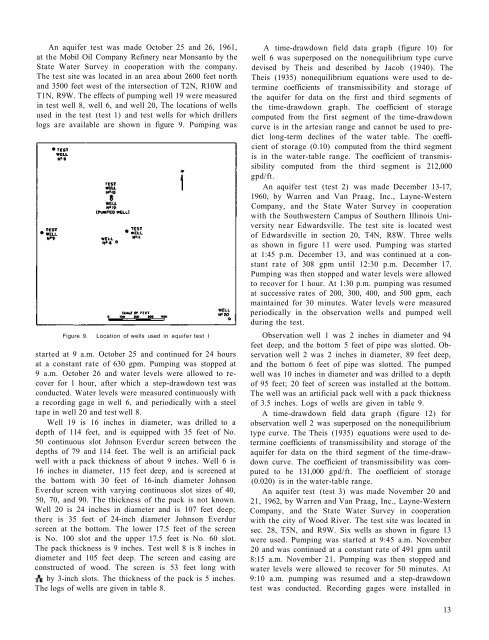
An aquifer test was made October 25 and 26, 1961,<br />
at the Mobil Oil Company Ref<strong>in</strong>ery near Monsanto by the<br />
<strong>St</strong>ate Water Survey <strong>in</strong> cooperation with the company.<br />
The test site was located <strong>in</strong> an <strong>area</strong> about 2600 feet north<br />
and 3500 feet west of the <strong>in</strong>tersection of T2N, R10W and<br />
T1N, R9W. The effects of pump<strong>in</strong>g well 19 were measured<br />
<strong>in</strong> test well 8, well 6, and well 20, The locations of wells<br />
used <strong>in</strong> the test (test 1) and test wells for which drillers<br />
logs are available are shown <strong>in</strong> figure 9. Pump<strong>in</strong>g was<br />
Figure 9.<br />
Location of wells used <strong>in</strong> aquifer test I<br />
started at 9 a.m. October 25 and cont<strong>in</strong>ued for 24 hours<br />
at a constant rate of 630 gpm. Pump<strong>in</strong>g was stopped at<br />
9 a.m. October 26 and <strong>water</strong> levels were allowed to recover<br />
for 1 hour, after which a step-drawdown test was<br />
conducted. Water levels were measured cont<strong>in</strong>uously with<br />
a record<strong>in</strong>g gage <strong>in</strong> well 6, and periodically with a steel<br />
tape <strong>in</strong> well 20 and test well 8.<br />
Well 19 is 16 <strong>in</strong>ches <strong>in</strong> diameter, was drilled to a<br />
depth of 114 feet, and is equipped with 35 feet of No.<br />
50 cont<strong>in</strong>uous slot Johnson Everdur screen between the<br />
depths of 79 and 114 feet. The well is an artificial pack<br />
well with a pack thickness of about 9 <strong>in</strong>ches. Well 6 is<br />
16 <strong>in</strong>ches <strong>in</strong> diameter, 115 feet deep, and is screened at<br />
the bottom with 30 feet of 16-<strong>in</strong>ch diameter Johnson<br />
Everdur screen with vary<strong>in</strong>g cont<strong>in</strong>uous slot sizes of 40,<br />
50, 70, and 90. The thickness of the pack is not known.<br />
Well 20 is 24 <strong>in</strong>ches <strong>in</strong> diameter and is 107 feet deep;<br />
there is 35 feet of 24-<strong>in</strong>ch diameter Johnson Everdur<br />
screen at the bottom. The lower 17.5 feet of the screen<br />
is No. 100 slot and the upper 17.5 feet is No. 60 slot.<br />
The pack thickness is 9 <strong>in</strong>ches. Test well 8 is 8 <strong>in</strong>ches <strong>in</strong><br />
diameter and 105 feet deep. The screen and cas<strong>in</strong>g are<br />
constructed of wood. The screen is 53 feet long with<br />
by 3-<strong>in</strong>ch slots. The thickness of the pack is 5 <strong>in</strong>ches.<br />
The logs of wells are given <strong>in</strong> table 8.<br />
A time-drawdown field data graph (figure 10) for<br />
well 6 was superposed on the nonequilibrium type curve<br />
devised by Theis and described by Jacob (1940). The<br />
Theis (1935) nonequilibrium equations were used to determ<strong>in</strong>e<br />
coefficients of transmissibility and storage of<br />
the aquifer for data on the first and third segments of<br />
the time-drawdown graph. The coefficient of storage<br />
computed from the first segment of the time-drawdown<br />
curve is <strong>in</strong> the artesian range and cannot be used to predict<br />
long-term decl<strong>in</strong>es of the <strong>water</strong> table. The coefficient<br />
of storage (0.10) computed from the third segment<br />
is <strong>in</strong> the <strong>water</strong>-table range. The coefficient of transmissibility<br />
computed from the third segment is 212,000<br />
gpd/ft.<br />
An aquifer test (test 2) was made December 13-17,<br />
1960, by Warren and Van Praag, Inc., Layne-Western<br />
Company, and the <strong>St</strong>ate Water Survey <strong>in</strong> cooperation<br />
with the Southwestern Campus of Southern Ill<strong>in</strong>ois University<br />
near Edwardsville. The test site is located west<br />
of Edwardsville <strong>in</strong> section 20, T4N, R8W. Three wells<br />
as shown <strong>in</strong> figure 11 were used. Pump<strong>in</strong>g was started<br />
at 1:45 p.m. December 13, and was cont<strong>in</strong>ued at a constant<br />
rate of 308 gpm until 12:30 p.m. December 17.<br />
Pump<strong>in</strong>g was then stopped and <strong>water</strong> levels were allowed<br />
to recover for 1 hour. At 1:30 p.m. pump<strong>in</strong>g was resumed<br />
at successive rates of 200, 300, 400, and 500 gpm, each<br />
ma<strong>in</strong>ta<strong>in</strong>ed for 30 m<strong>in</strong>utes. Water levels were measured<br />
periodically <strong>in</strong> the observation wells and pumped well<br />
dur<strong>in</strong>g the test.<br />
Observation well 1 was 2 <strong>in</strong>ches <strong>in</strong> diameter and 94<br />
feet deep, and the bottom 5 feet of pipe was slotted. Observation<br />
well 2 was 2 <strong>in</strong>ches <strong>in</strong> diameter, 89 feet deep,<br />
and the bottom 6 feet of pipe was slotted. The pumped<br />
well was 10 <strong>in</strong>ches <strong>in</strong> diameter and was drilled to a depth<br />
of 95 feet; 20 feet of screen was <strong>in</strong>stalled at the bottom.<br />
The well was an artificial pack well with a pack thickness<br />
of 3.5 <strong>in</strong>ches. Logs of wells are given <strong>in</strong> table 9.<br />
A time-drawdown field data graph (figure 12) for<br />
observation well 2 was superposed on the nonequilibrium<br />
type curve. The Theis (1935) equations were used to determ<strong>in</strong>e<br />
coefficients of transmissibility and storage of the<br />
aquifer for data on the third segment of the time-drawdown<br />
curve. The coefficient of transmissibility was computed<br />
to be 131,000 gpd/ft. The coefficient of storage<br />
(0.020) is <strong>in</strong> the <strong>water</strong>-table range.<br />
An aquifer test (test 3) was made November 20 and<br />
21, 1962, by Warren and Van Praag, Inc., Layne-Western<br />
Company, and the <strong>St</strong>ate Water Survey <strong>in</strong> cooperation<br />
with the city of Wood River. The test site was located <strong>in</strong><br />
sec. 28, T5N, and R9W. Six wells as shown <strong>in</strong> figure 13<br />
were used. Pump<strong>in</strong>g was started at 9:45 a.m. November<br />
20 and was cont<strong>in</strong>ued at a constant rate of 491 gpm until<br />
8:15 a.m. November 21. Pump<strong>in</strong>g was then stopped and<br />
<strong>water</strong> levels were allowed to recover for 50 m<strong>in</strong>utes. At<br />
9:10 a.m. pump<strong>in</strong>g was resumed and a step-drawdown<br />
test was conducted. Record<strong>in</strong>g gages were <strong>in</strong>stalled <strong>in</strong><br />
13