Ground-water development in East St. Louis area, Illinois. Urbana, IL ...
Ground-water development in East St. Louis area, Illinois. Urbana, IL ...
Ground-water development in East St. Louis area, Illinois. Urbana, IL ...

Create successful ePaper yourself
Turn your PDF publications into a flip-book with our unique Google optimized e-Paper software.
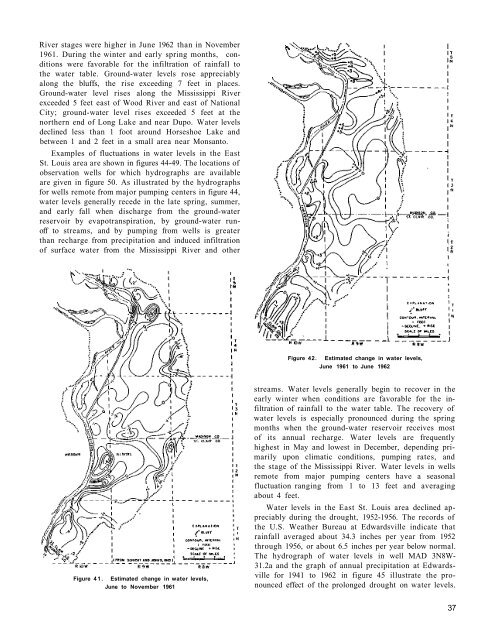
River stages were higher <strong>in</strong> June 1962 than <strong>in</strong> November<br />
1961. Dur<strong>in</strong>g the w<strong>in</strong>ter and early spr<strong>in</strong>g months, conditions<br />
were favorable for the <strong>in</strong>filtration of ra<strong>in</strong>fall to<br />
the <strong>water</strong> table. <strong>Ground</strong>-<strong>water</strong> levels rose appreciably<br />
along the bluffs, the rise exceed<strong>in</strong>g 7 feet <strong>in</strong> places.<br />
<strong>Ground</strong>-<strong>water</strong> level rises along the Mississippi River<br />
exceeded 5 feet east of Wood River and east of National<br />
City; ground-<strong>water</strong> level rises exceeded 5 feet at the<br />
northern end of Long Lake and near Dupo. Water levels<br />
decl<strong>in</strong>ed less than 1 foot around Horseshoe Lake and<br />
between 1 and 2 feet <strong>in</strong> a small <strong>area</strong> near Monsanto.<br />
Examples of fluctuations <strong>in</strong> <strong>water</strong> levels <strong>in</strong> the <strong>East</strong><br />
<strong>St</strong>. <strong>Louis</strong> <strong>area</strong> are shown <strong>in</strong> figures 44-49. The locations of<br />
observation wells for which hydrographs are available<br />
are given <strong>in</strong> figure 50. As illustrated by the hydrographs<br />
for wells remote from major pump<strong>in</strong>g centers <strong>in</strong> figure 44,<br />
<strong>water</strong> levels generally recede <strong>in</strong> the late spr<strong>in</strong>g, summer,<br />
and early fall when discharge from the ground-<strong>water</strong><br />
reservoir by evapotranspiration, by ground-<strong>water</strong> runoff<br />
to streams, and by pump<strong>in</strong>g from wells is greater<br />
than recharge from precipitation and <strong>in</strong>duced <strong>in</strong>filtration<br />
of surface <strong>water</strong> from the Mississippi River and other<br />
Figure 42.<br />
Estimated change <strong>in</strong> <strong>water</strong> levels,<br />
June 1961 to June 1962<br />
Figure 41.<br />
Estimated change <strong>in</strong> <strong>water</strong> levels,<br />
June to November 1961<br />
streams. Water levels generally beg<strong>in</strong> to recover <strong>in</strong> the<br />
early w<strong>in</strong>ter when conditions are favorable for the <strong>in</strong>filtration<br />
of ra<strong>in</strong>fall to the <strong>water</strong> table. The recovery of<br />
<strong>water</strong> levels is especially pronounced dur<strong>in</strong>g the spr<strong>in</strong>g<br />
months when the ground-<strong>water</strong> reservoir receives most<br />
of its annual recharge. Water levels are frequently<br />
highest <strong>in</strong> May and lowest <strong>in</strong> December, depend<strong>in</strong>g primarily<br />
upon climatic conditions, pump<strong>in</strong>g rates, and<br />
the stage of the Mississippi River. Water levels <strong>in</strong> wells<br />
remote from major pump<strong>in</strong>g centers have a seasonal<br />
fluctuation rang<strong>in</strong>g from 1 to 13 feet and averag<strong>in</strong>g<br />
about 4 feet.<br />
Water levels <strong>in</strong> the <strong>East</strong> <strong>St</strong>. <strong>Louis</strong> <strong>area</strong> decl<strong>in</strong>ed appreciably<br />
dur<strong>in</strong>g the drought, 1952-1956. The records of<br />
the U.S. Weather Bureau at Edwardsville <strong>in</strong>dicate that<br />
ra<strong>in</strong>fall averaged about 34.3 <strong>in</strong>ches per year from 1952<br />
through 1956, or about 6.5 <strong>in</strong>ches per year below normal.<br />
The hydrograph of <strong>water</strong> levels <strong>in</strong> well MAD 3N8W-<br />
31.2a and the graph of annual precipitation at Edwardsville<br />
for 1941 to 1962 <strong>in</strong> figure 45 illustrate the pronounced<br />
effect of the prolonged drought on <strong>water</strong> levels.<br />
37