Ground-water development in East St. Louis area, Illinois. Urbana, IL ...
Ground-water development in East St. Louis area, Illinois. Urbana, IL ...
Ground-water development in East St. Louis area, Illinois. Urbana, IL ...

You also want an ePaper? Increase the reach of your titles
YUMPU automatically turns print PDFs into web optimized ePapers that Google loves.
of the drought and changes <strong>in</strong> river stage are taken<br />
<strong>in</strong>to consideration, <strong>water</strong>-level decl<strong>in</strong>es are directly proportional<br />
to pump<strong>in</strong>g rates. The <strong>water</strong> levels vary from<br />
place to place with<strong>in</strong> pumpage centers and from time to<br />
time mostly because of the shift<strong>in</strong>g of pumpage from<br />
well to well, shift<strong>in</strong>g of pumpage from pumpage centers<br />
1 mile or more from the Mississippi River to pumpage<br />
centers near the river, and variations <strong>in</strong> total well field<br />
pumpage. At no location is there any apparent cont<strong>in</strong>uous<br />
decl<strong>in</strong>e that cannot be expla<strong>in</strong>ed by pumpage <strong>in</strong>creases.<br />
Thus, with<strong>in</strong> a relatively short time after each<br />
<strong>in</strong>crease <strong>in</strong> pumpage, recharge directly from precipitation<br />
and by <strong>in</strong>duced <strong>in</strong>filtration of <strong>water</strong> <strong>in</strong> streams <strong>in</strong>creased<br />
<strong>in</strong> proportion to pumpage as hydraulic gradients<br />
became greater and <strong>area</strong>s of diversion expanded.<br />
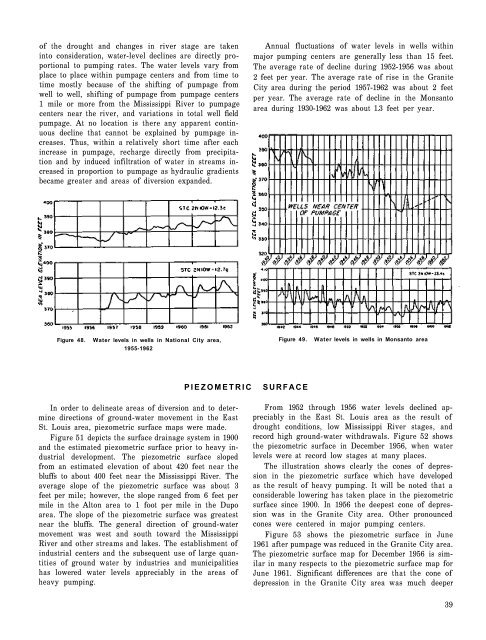
Annual fluctuations of <strong>water</strong> levels <strong>in</strong> wells with<strong>in</strong><br />
major pump<strong>in</strong>g centers are generally less than 15 feet.<br />
The average rate of decl<strong>in</strong>e dur<strong>in</strong>g 1952-1956 was about<br />
2 feet per year. The average rate of rise <strong>in</strong> the Granite<br />
City <strong>area</strong> dur<strong>in</strong>g the period 1957-1962 was about 2 feet<br />
per year. The average rate of decl<strong>in</strong>e <strong>in</strong> the Monsanto<br />
<strong>area</strong> dur<strong>in</strong>g 1930-1962 was about 1.3 feet per year.<br />
Figure 48.<br />
Water levels <strong>in</strong> wells <strong>in</strong> National City <strong>area</strong>,<br />
Figure 49.<br />
Water levels <strong>in</strong> wells <strong>in</strong> Monsanto <strong>area</strong><br />
1955-1962<br />
PIEZOMETRIC<br />
SURFACE<br />
In order to del<strong>in</strong>eate <strong>area</strong>s of diversion and to determ<strong>in</strong>e<br />
directions of ground-<strong>water</strong> movement <strong>in</strong> the <strong>East</strong><br />
<strong>St</strong>. <strong>Louis</strong> <strong>area</strong>, piezometric surface maps were made.<br />
Figure 51 depicts the surface dra<strong>in</strong>age system <strong>in</strong> 1900<br />
and the estimated piezometric surface prior to heavy <strong>in</strong>dustrial<br />
<strong>development</strong>. The piezometric surface sloped<br />
from an estimated elevation of about 420 feet near the<br />
bluffs to about 400 feet near the Mississippi River. The<br />
average slope of the piezometric surface was about 3<br />
feet per mile; however, the slope ranged from 6 feet per<br />
mile <strong>in</strong> the Alton <strong>area</strong> to 1 foot per mile <strong>in</strong> the Dupo<br />
<strong>area</strong>. The slope of the piezometric surface was greatest<br />
near the bluffs. The general direction of ground-<strong>water</strong><br />
movement was west and south toward the Mississippi<br />
River and other streams and lakes. The establishment of<br />
<strong>in</strong>dustrial centers and the subsequent use of large quantities<br />
of ground <strong>water</strong> by <strong>in</strong>dustries and municipalities<br />
has lowered <strong>water</strong> levels appreciably <strong>in</strong> the <strong>area</strong>s of<br />
heavy pump<strong>in</strong>g.<br />
From 1952 through 1956 <strong>water</strong> levels decl<strong>in</strong>ed appreciably<br />
<strong>in</strong> the <strong>East</strong> <strong>St</strong>. <strong>Louis</strong> <strong>area</strong> as the result of<br />
drought conditions, low Mississippi River stages, and<br />
record high ground-<strong>water</strong> withdrawals. Figure 52 shows<br />
the piezometric surface <strong>in</strong> December 1956, when <strong>water</strong><br />
levels were at record low stages at many places.<br />
The illustration shows clearly the cones of depression<br />
<strong>in</strong> the piezometric surface which have developed<br />
as the result of heavy pump<strong>in</strong>g. It will be noted that a<br />
considerable lower<strong>in</strong>g has taken place <strong>in</strong> the piezometric<br />
surface s<strong>in</strong>ce 1900. In 1956 the deepest cone of depression<br />
was <strong>in</strong> the Granite City <strong>area</strong>. Other pronounced<br />
cones were centered <strong>in</strong> major pump<strong>in</strong>g centers.<br />
Figure 53 shows the piezometric surface <strong>in</strong> June<br />
1961 after pumpage was reduced <strong>in</strong> the Granite City <strong>area</strong>.<br />
The piezometric surface map for December 1956 is similar<br />
<strong>in</strong> many respects to the piezometric surface map for<br />
June 1961. Significant differences are that the cone of<br />
depression <strong>in</strong> the Granite City <strong>area</strong> was much deeper<br />
39