Ground-water development in East St. Louis area, Illinois. Urbana, IL ...
Ground-water development in East St. Louis area, Illinois. Urbana, IL ...
Ground-water development in East St. Louis area, Illinois. Urbana, IL ...

Create successful ePaper yourself
Turn your PDF publications into a flip-book with our unique Google optimized e-Paper software.
a test hole near Monsanto. The coefficient of permeability<br />
of the aquifer <strong>in</strong> the vic<strong>in</strong>ity of the test hole was estimated<br />
to be 3000 gpd/sq ft from aquifer-test data. The<br />
50 percent size of the materials <strong>in</strong> the f<strong>in</strong>est sample is<br />
less than 4 times the 50 percent size of the materials <strong>in</strong><br />
the coarsest sample; therefore, the slot size should not<br />
be tailored to <strong>in</strong>dividual samples but should be based on<br />
the mechanical analysis of the f<strong>in</strong>est sample. The effective<br />
gra<strong>in</strong> sizes of all three samples are greater than 0.01 and<br />
uniformity coefficients are greater than 3. A natural<br />
pack well is therefore <strong>in</strong>dicated. The materials overly<strong>in</strong>g<br />
the aquifer will not easily cave so the sieve size (0.060<br />
<strong>in</strong>ch) that reta<strong>in</strong>s 40 percent of the aquifer materials is<br />
selected as the proper slot size.<br />
Suppose a pump<strong>in</strong>g rate of 1000 gpm is desired.<br />
Computations made with equation 9, <strong>in</strong>dicate that 26<br />
feet of 16-<strong>in</strong>ch cont<strong>in</strong>uous slot screen with a slot open<strong>in</strong>g<br />
of 0.060 <strong>in</strong>ches is needed. The effective open <strong>area</strong> of<br />
the screen is estimated to be 0.640 sq ft per foot of the<br />
screen. The optimum screen entrance velocity (table 20)<br />
is equal to 8 fpm.<br />
Alternate designs to the above example are possible by<br />
us<strong>in</strong>g a small diameter screen with a longer length or a<br />
larger diameter screen with a shorter length.<br />
The follow<strong>in</strong>g are well diameters that have been used<br />
<strong>in</strong> Ill<strong>in</strong>ois (Smith, 1961):<br />
Pump<strong>in</strong>g<br />
rate<br />
(gpm)<br />
Diameter<br />
of well<br />
(<strong>in</strong>)<br />
125 6<br />
300 8<br />
600 10<br />
1200 12<br />
2000 14<br />
3000 16<br />
Experience has shown that <strong>in</strong> the case of a multiple<br />
well system consist<strong>in</strong>g of more than two wells the proper<br />
spac<strong>in</strong>g between wells is at least 250 feet.<br />
GROUND-WATER<br />
The first significant withdrawal of ground <strong>water</strong> <strong>in</strong><br />
the <strong>East</strong> <strong>St</strong>. <strong>Louis</strong> <strong>area</strong> started <strong>in</strong> the late 1890s. Prior to<br />
1900 ground <strong>water</strong> was primarily used for domestic and<br />
farm supplies; s<strong>in</strong>ce 1900 pumpage has been mostly for<br />
<strong>in</strong>dustrial use. The first record of an <strong>in</strong>dustrial well <strong>in</strong> the<br />
<strong>East</strong> <strong>St</strong>. <strong>Louis</strong> <strong>area</strong> is for a well drilled <strong>in</strong> 1894 by the Big<br />
Four Railroad <strong>in</strong> <strong>East</strong> Alton (Bowman and Reeds, 1907).<br />
The well was 54 feet deep and 8 <strong>in</strong>ches <strong>in</strong> diameter, and<br />
was pumped at an average rate of 75,000 gpd. The<br />
<strong>water</strong> was used primarily <strong>in</strong> locomotive boilers. The<br />
meat pack<strong>in</strong>g <strong>in</strong>dustry <strong>in</strong> National City started to pump<br />
large quantities of ground <strong>water</strong> <strong>in</strong> 1900. Accord<strong>in</strong>g to<br />
Schicht and Jones (1962), estimated pumpage from<br />
wells <strong>in</strong> the National City <strong>area</strong> <strong>in</strong>creased from 400,000<br />
gpd <strong>in</strong> 1900 to 5.3 mgd <strong>in</strong> 1910. The first municipal well<br />
was drilled <strong>in</strong> 1899 by Edwardsville at a site near Poag<br />
and was pumped at an average rate of 300,000 gpd. The<br />
second municipal well was drilled <strong>in</strong> 1901 by Coll<strong>in</strong>sville<br />
at a site about a mile north of Caseyville and was<br />
pumped at an average rate of 100,000 gpd. Pumpage<br />
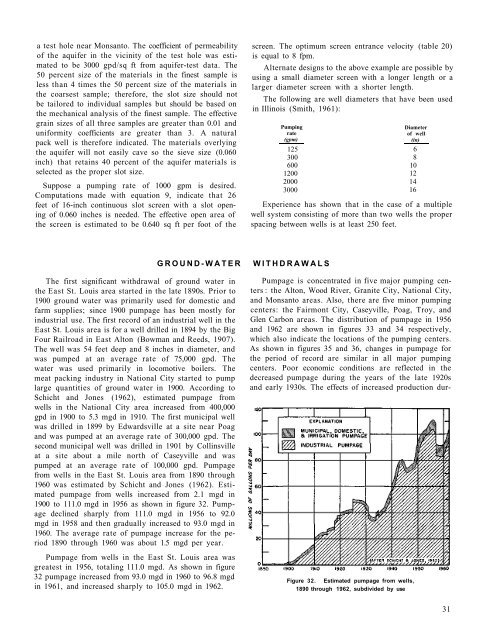
from wells <strong>in</strong> the <strong>East</strong> <strong>St</strong>. <strong>Louis</strong> <strong>area</strong> from 1890 through<br />
1960 was estimated by Schicht and Jones (1962). Estimated<br />
pumpage from wells <strong>in</strong>creased from 2.1 mgd <strong>in</strong><br />
1900 to 111.0 mgd <strong>in</strong> 1956 as shown <strong>in</strong> figure 32. Pumpage<br />
decl<strong>in</strong>ed sharply from 111.0 mgd <strong>in</strong> 1956 to 92.0<br />
mgd <strong>in</strong> 1958 and then gradually <strong>in</strong>creased to 93.0 mgd <strong>in</strong><br />
1960. The average rate of pumpage <strong>in</strong>crease for the period<br />
1890 through 1960 was about 1.5 mgd per year.<br />
Pumpage from wells <strong>in</strong> the <strong>East</strong> <strong>St</strong>. <strong>Louis</strong> <strong>area</strong> was<br />
greatest <strong>in</strong> 1956, total<strong>in</strong>g 111.0 mgd. As shown <strong>in</strong> figure<br />
32 pumpage <strong>in</strong>creased from 93.0 mgd <strong>in</strong> 1960 to 96.8 mgd<br />
<strong>in</strong> 1961, and <strong>in</strong>creased sharply to 105.0 mgd <strong>in</strong> 1962.<br />
WITHDRAWALS<br />
Pumpage is concentrated <strong>in</strong> five major pump<strong>in</strong>g centers<br />
: the Alton, Wood River, Granite City, National City,<br />
and Monsanto <strong>area</strong>s. Also, there are five m<strong>in</strong>or pump<strong>in</strong>g<br />
centers: the Fairmont City, Caseyville, Poag, Troy, and<br />
Glen Carbon <strong>area</strong>s. The distribution of pumpage <strong>in</strong> 1956<br />
and 1962 are shown <strong>in</strong> figures 33 and 34 respectively,<br />
which also <strong>in</strong>dicate the locations of the pump<strong>in</strong>g centers.<br />
As shown <strong>in</strong> figures 35 and 36, changes <strong>in</strong> pumpage for<br />
the period of record are similar <strong>in</strong> all major pump<strong>in</strong>g<br />
centers. Poor economic conditions are reflected <strong>in</strong> the<br />
decreased pumpage dur<strong>in</strong>g the years of the late 1920s<br />
and early 1930s. The effects of <strong>in</strong>creased production dur-<br />
Figure 32. Estimated pumpage from wells,<br />
1890 through 1962, subdivided by use<br />
31