Ground-water development in East St. Louis area, Illinois. Urbana, IL ...
Ground-water development in East St. Louis area, Illinois. Urbana, IL ...
Ground-water development in East St. Louis area, Illinois. Urbana, IL ...

You also want an ePaper? Increase the reach of your titles
YUMPU automatically turns print PDFs into web optimized ePapers that Google loves.
wells conta<strong>in</strong> slotted pipe screens. Irrigation wells range<br />
<strong>in</strong> diameter from 8 to 16 <strong>in</strong>ches and usually have pack<br />
thicknesses of 6 to 8 <strong>in</strong>ches. Lengths of slotted pipe<br />
screens range from 10 to 40 feet.<br />
Service Life of Wells and Collector Wells<br />
One of the problems <strong>in</strong> the <strong>East</strong> <strong>St</strong>. <strong>Louis</strong> <strong>area</strong> associated<br />
with the <strong>development</strong> of ground-<strong>water</strong> resources<br />
is the short life expectancy of wells. Accord<strong>in</strong>g to a<br />
study by Bru<strong>in</strong> and Smith (1953), the median service<br />
life of municipal wells term<strong>in</strong>at<strong>in</strong>g <strong>in</strong> sand and gravel<br />
formations <strong>in</strong> the <strong>East</strong> <strong>St</strong>. <strong>Louis</strong> <strong>area</strong> is about half that<br />
for similar municipal wells <strong>in</strong> other parts of the state.<br />
Nearly all of the wells retired <strong>in</strong> the <strong>area</strong> were taken<br />
out of service either because the screens had become partially<br />
clogged or the wells had filled with sand.<br />
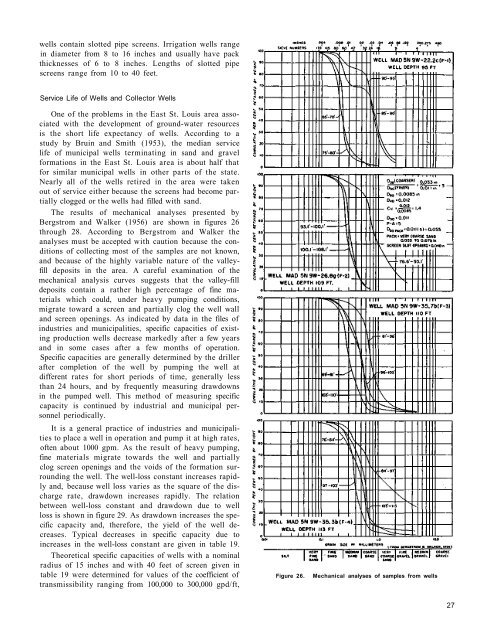
The results of mechanical analyses presented by<br />
Bergstrom and Walker (1956) are shown <strong>in</strong> figures 26<br />
through 28. Accord<strong>in</strong>g to Bergstrom and Walker the<br />
analyses must be accepted with caution because the conditions<br />
of collect<strong>in</strong>g most of the samples are not known,<br />
and because of the highly variable nature of the valleyfill<br />
deposits <strong>in</strong> the <strong>area</strong>. A careful exam<strong>in</strong>ation of the<br />
mechanical analysis curves suggests that the valley-fill<br />
deposits conta<strong>in</strong> a rather high percentage of f<strong>in</strong>e materials<br />
which could, under heavy pump<strong>in</strong>g conditions,<br />
migrate toward a screen and partially clog the well wall<br />
and screen open<strong>in</strong>gs. As <strong>in</strong>dicated by data <strong>in</strong> the files of<br />
<strong>in</strong>dustries and municipalities, specific capacities of exist<strong>in</strong>g<br />
production wells decrease markedly after a few years<br />
and <strong>in</strong> some cases after a few months of operation.<br />
Specific capacities are generally determ<strong>in</strong>ed by the driller<br />
after completion of the well by pump<strong>in</strong>g the well at<br />
different rates for short periods of time, generally less<br />
than 24 hours, and by frequently measur<strong>in</strong>g drawdowns<br />
<strong>in</strong> the pumped well. This method of measur<strong>in</strong>g specific<br />
capacity is cont<strong>in</strong>ued by <strong>in</strong>dustrial and municipal personnel<br />
periodically.<br />
It is a general practice of <strong>in</strong>dustries and municipalities<br />
to place a well <strong>in</strong> operation and pump it at high rates,<br />
often about 1000 gpm. As the result of heavy pump<strong>in</strong>g,<br />
f<strong>in</strong>e materials migrate towards the well and partially<br />
clog screen open<strong>in</strong>gs and the voids of the formation surround<strong>in</strong>g<br />
the well. The well-loss constant <strong>in</strong>creases rapidly<br />
and, because well loss varies as the square of the discharge<br />
rate, drawdown <strong>in</strong>creases rapidly. The relation<br />
between well-loss constant and drawdown due to well<br />
loss is shown <strong>in</strong> figure 29. As drawdown <strong>in</strong>creases the specific<br />
capacity and, therefore, the yield of the well decreases.<br />
Typical decreases <strong>in</strong> specific capacity due to<br />
<strong>in</strong>creases <strong>in</strong> the well-loss constant are given <strong>in</strong> table 19.<br />
Theoretical specific capacities of wells with a nom<strong>in</strong>al<br />
radius of 15 <strong>in</strong>ches and with 40 feet of screen given <strong>in</strong><br />
table 19 were determ<strong>in</strong>ed for values of the coefficient of<br />
transmissibility rang<strong>in</strong>g from 100,000 to 300,000 gpd/ft,<br />
Figure 26.<br />
Mechanical analyses of samples from wells<br />
27