Ground-water development in East St. Louis area, Illinois. Urbana, IL ...
Ground-water development in East St. Louis area, Illinois. Urbana, IL ...
Ground-water development in East St. Louis area, Illinois. Urbana, IL ...

Create successful ePaper yourself
Turn your PDF publications into a flip-book with our unique Google optimized e-Paper software.
Table 36.<br />
Recharge with Selected Scheme of Development and <strong>in</strong> 1956 and 1961, Subdivided by Source<br />
Selected scheme of <strong>development</strong> 1956 1961<br />
Sub- Induced Sub- Induced Sub- Induced<br />
Precipi- surface <strong>in</strong>fil- Total Precipi- surface <strong>in</strong>fil- Total Precipi- surface <strong>in</strong>fil- Total<br />
Pump<strong>in</strong>g tation flow tration pumpage tation flow tration pumpage tation flow tration pumpage<br />
center (mgd) (mgd) (mgd) (mgd) (mgd) (mgd) (mgd) (mgd) (mgd) (mgd) (mgd) (mgd)<br />
Alton <strong>area</strong> 1.8 2.0 19.2 23.0 1.4 1.4 7.0 9.8 1.0 1.1 10.2 12.3<br />
Wood River <strong>area</strong> 7.3 2.6 24.3 34.2 7.1 3.0 11.0 21.1 7.2 2.6 14.5 24.3<br />
Mitchell <strong>area</strong> 9.3 1.3 7.4 18.0<br />
Granite City<br />
<strong>area</strong> 11.2 0.9 2.9 15.0 16.8 1.8 * 30.1 7.7 1.1 8.8<br />
National City<br />
<strong>area</strong> 9.9 2.0 18.6 30.5 9.0 1.1 3.7 13.8 6.9 3.9 10.8<br />
Monsanto <strong>area</strong> 9.5 24.5 34.0 10.7 0.7 18.7 30.1 12.6 0.8 18.5 31.9<br />
Dupo <strong>area</strong> 19.0<br />
Poag 2.0 2.0 0.9 0.9 1.2 1.2<br />
Glen Carbon 0.8 0.2 1.0 0.2 0.2 0.3 0.3<br />
Troy 0.8 0.2 1.0 0.3 0.3 0.4 0.4<br />
Caseyville 2.9 1.1 4.0 1.3 1.0 2.3 1.4 1.0 2.4<br />
Fairmont City 6.0 6.0 2.4 2.4 4.4 4.4<br />
Total 61.5 10.3 96.9 187.7 50.1 9.0 111.0 43.1 5.5 48.2 96.8<br />
*Not computed; <strong>water</strong> be<strong>in</strong>g taken out of storage<br />
WATER<br />
The chemical character of the ground-<strong>water</strong> <strong>in</strong> the<br />
<strong>East</strong> <strong>St</strong>. <strong>Louis</strong> <strong>area</strong> is known from the analyses of <strong>water</strong><br />
from 183 wells. The results of the analyses are given<br />
<strong>in</strong> table 37. The constituents listed <strong>in</strong> the table are given<br />
<strong>in</strong> ionic form <strong>in</strong> parts per million. The analyses of <strong>water</strong><br />
from wells were made by the Chemistry Section of the<br />
<strong>St</strong>ate Water Survey. Chemical analyses of <strong>water</strong> from<br />
wells at several sites <strong>in</strong> the <strong>area</strong> are made monthly by the<br />
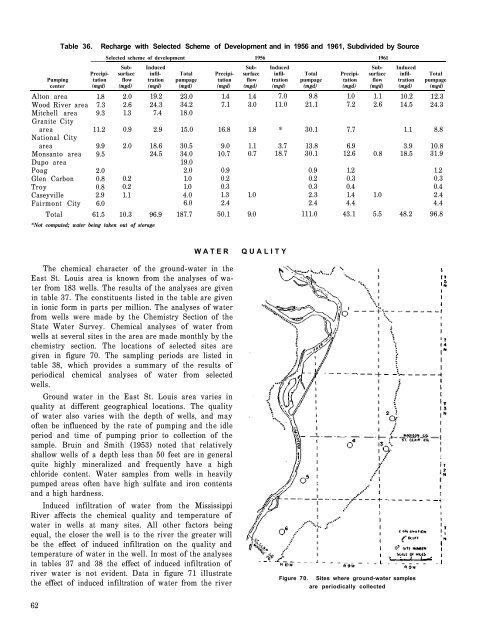
chemistry section. The locations of selected sites are<br />
given <strong>in</strong> figure 70. The sampl<strong>in</strong>g periods are listed <strong>in</strong><br />
table 38, which provides a summary of the results of<br />
periodical chemical analyses of <strong>water</strong> from selected<br />
wells.<br />
<strong>Ground</strong> <strong>water</strong> <strong>in</strong> the <strong>East</strong> <strong>St</strong>. <strong>Louis</strong> <strong>area</strong> varies <strong>in</strong><br />
quality at different geographical locations. The quality<br />
of <strong>water</strong> also varies with the depth of wells, and may<br />
often be <strong>in</strong>fluenced by the rate of pump<strong>in</strong>g and the idle<br />
period and time of pump<strong>in</strong>g prior to collection of the<br />
sample. Bru<strong>in</strong> and Smith (1953) noted that relatively<br />
shallow wells of a depth less than 50 feet are <strong>in</strong> general<br />
quite highly m<strong>in</strong>eralized and frequently have a high<br />
chloride content. Water samples from wells <strong>in</strong> heavily<br />
pumped <strong>area</strong>s often have high sulfate and iron contents<br />
and a high hardness.<br />
Induced <strong>in</strong>filtration of <strong>water</strong> from the Mississippi<br />
River affects the chemical quality and temperature of<br />
<strong>water</strong> <strong>in</strong> wells at many sites. All other factors be<strong>in</strong>g<br />
equal, the closer the well is to the river the greater will<br />
be the effect of <strong>in</strong>duced <strong>in</strong>filtration on the quality and<br />
temperature of <strong>water</strong> <strong>in</strong> the well. In most of the analyses<br />
<strong>in</strong> tables 37 and 38 the effect of <strong>in</strong>duced <strong>in</strong>filtration of<br />
river <strong>water</strong> is not evident. Data <strong>in</strong> figure 71 illustrate<br />
the effect of <strong>in</strong>duced <strong>in</strong>filtration of <strong>water</strong> from the river<br />
QUALITY<br />
Figure 70. Sites where ground-<strong>water</strong> samples<br />
are periodically collected<br />
62