Ground-water development in East St. Louis area, Illinois. Urbana, IL ...
Ground-water development in East St. Louis area, Illinois. Urbana, IL ...
Ground-water development in East St. Louis area, Illinois. Urbana, IL ...

You also want an ePaper? Increase the reach of your titles
YUMPU automatically turns print PDFs into web optimized ePapers that Google loves.
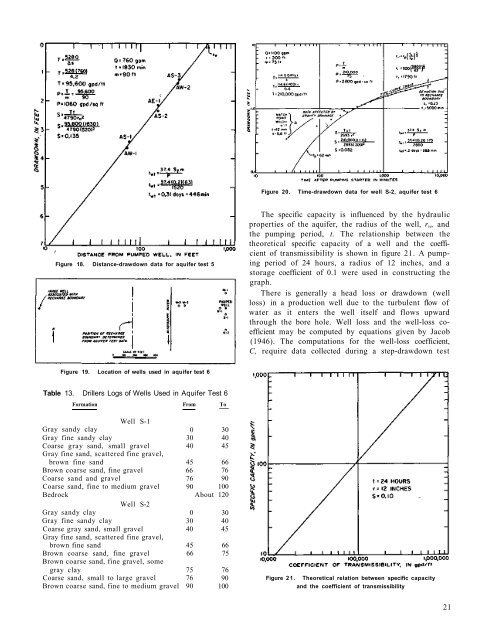
Figure 20. Time-drawdown data for well S-2, aquifer test 6<br />
Figure 18. Distance-drawdown data for aquifer test 5<br />
The specific capacity is <strong>in</strong>fluenced by the hydraulic<br />
properties of the aquifer, the radius of the well, r w , and<br />
the pump<strong>in</strong>g period, t. The relationship between the<br />
theoretical specific capacity of a well and the coefficient<br />
of transmissibility is shown <strong>in</strong> figure 21. A pump<strong>in</strong>g<br />
period of 24 hours, a radius of 12 <strong>in</strong>ches, and a<br />
storage coefficient of 0.1 were used <strong>in</strong> construct<strong>in</strong>g the<br />
graph.<br />
There is generally a head loss or drawdown (well<br />
loss) <strong>in</strong> a production well due to the turbulent flow of<br />
<strong>water</strong> as it enters the well itself and flows upward<br />
through the bore hole. Well loss and the well-loss coefficient<br />
may be computed by equations given by Jacob<br />
(1946). The computations for the well-loss coefficient,<br />
C, require data collected dur<strong>in</strong>g a step-drawdown test<br />
Figure 19. Location of wells used <strong>in</strong> aquifer test 6<br />
Table 13. Drillers Logs of Wells Used <strong>in</strong> Aquifer Test 6<br />
Formation From To<br />
Well S-1<br />
Gray sandy clay 0 30<br />
Gray f<strong>in</strong>e sandy clay 30 40<br />
Coarse gray sand, small gravel 40 45<br />
Gray f<strong>in</strong>e sand, scattered f<strong>in</strong>e gravel,<br />
brown f<strong>in</strong>e sand 45 66<br />
Brown coarse sand, f<strong>in</strong>e gravel 66 76<br />
Coarse sand and gravel 76 90<br />
Coarse sand, f<strong>in</strong>e to medium gravel 90 100<br />
Bedrock About 120<br />
Well S-2<br />
Gray sandy clay 0 30<br />
Gray f<strong>in</strong>e sandy clay 30 40<br />
Coarse gray sand, small gravel 40 45<br />
Gray f<strong>in</strong>e sand, scattered f<strong>in</strong>e gravel,<br />
brown f<strong>in</strong>e sand 45 66<br />
Brown coarse sand, f<strong>in</strong>e gravel 66 75<br />
Brown coarse sand, f<strong>in</strong>e gravel, some<br />
gray clay 75 76<br />
Coarse sand, small to large gravel 76 90<br />
Brown coarse sand, f<strong>in</strong>e to medium gravel 90 100<br />
Figure 21.<br />
Theoretical relation between specific capacity<br />
and the coefficient of transmissibility<br />
21