F-22 Plus-Up Environmental Assessment - Joint Base Elmendorf ...
F-22 Plus-Up Environmental Assessment - Joint Base Elmendorf ...
F-22 Plus-Up Environmental Assessment - Joint Base Elmendorf ...

You also want an ePaper? Increase the reach of your titles
YUMPU automatically turns print PDFs into web optimized ePapers that Google loves.
F-<strong>22</strong> <strong>Plus</strong>-<strong>Up</strong> <strong>Environmental</strong> <strong>Assessment</strong><br />
Appendix D Aircraft Noise Analysis and Airspace Operations<br />
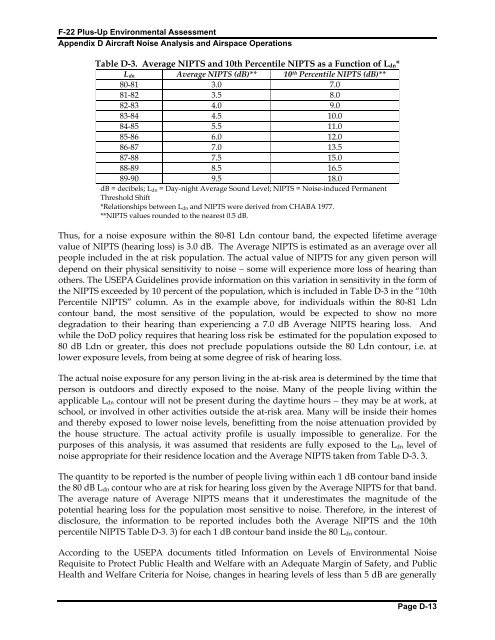
Table D-3. Average NIPTS and 10th Percentile NIPTS as a Function of L dn *<br />
L dn Average NIPTS (dB)** 10 th Percentile NIPTS (dB)**<br />
80-81 3.0 7.0<br />
81-82 3.5 8.0<br />
82-83 4.0 9.0<br />
83-84 4.5 10.0<br />
84-85 5.5 11.0<br />
85-86 6.0 12.0<br />
86-87 7.0 13.5<br />
87-88 7.5 15.0<br />
88-89 8.5 16.5<br />
89-90 9.5 18.0<br />
dB = decibels; L dn = Day-night Average Sound Level; NIPTS = Noise-induced Permanent<br />
Threshold Shift<br />
*Relationships between L dn and NIPTS were derived from CHABA 1977.<br />
**NIPTS values rounded to the nearest 0.5 dB.<br />
Thus, for a noise exposure within the 80-81 Ldn contour band, the expected lifetime average<br />
value of NIPTS (hearing loss) is 3.0 dB. The Average NIPTS is estimated as an average over all<br />
people included in the at risk population. The actual value of NIPTS for any given person will<br />
depend on their physical sensitivity to noise − some will experience more loss of hearing than<br />
others. The USEPA Guidelines provide information on this variation in sensitivity in the form of<br />
the NIPTS exceeded by 10 percent of the population, which is included in Table D-3 in the “10th<br />
Percentile NIPTS” column. As in the example above, for individuals within the 80-81 Ldn<br />
contour band, the most sensitive of the population, would be expected to show no more<br />
degradation to their hearing than experiencing a 7.0 dB Average NIPTS hearing loss. And<br />
while the DoD policy requires that hearing loss risk be estimated for the population exposed to<br />
80 dB Ldn or greater, this does not preclude populations outside the 80 Ldn contour, i.e. at<br />
lower exposure levels, from being at some degree of risk of hearing loss.<br />
The actual noise exposure for any person living in the at-risk area is determined by the time that<br />
person is outdoors and directly exposed to the noise. Many of the people living within the<br />
applicable L dn contour will not be present during the daytime hours − they may be at work, at<br />
school, or involved in other activities outside the at-risk area. Many will be inside their homes<br />
and thereby exposed to lower noise levels, benefitting from the noise attenuation provided by<br />
the house structure. The actual activity profile is usually impossible to generalize. For the<br />
purposes of this analysis, it was assumed that residents are fully exposed to the L dn level of<br />
noise appropriate for their residence location and the Average NIPTS taken from Table D-3. 3.<br />
The quantity to be reported is the number of people living within each 1 dB contour band inside<br />
the 80 dB L dn contour who are at risk for hearing loss given by the Average NIPTS for that band.<br />
The average nature of Average NIPTS means that it underestimates the magnitude of the<br />
potential hearing loss for the population most sensitive to noise. Therefore, in the interest of<br />
disclosure, the information to be reported includes both the Average NIPTS and the 10th<br />
percentile NIPTS Table D-3. 3) for each 1 dB contour band inside the 80 L dn contour.<br />
According to the USEPA documents titled Information on Levels of <strong>Environmental</strong> Noise<br />
Requisite to Protect Public Health and Welfare with an Adequate Margin of Safety, and Public<br />
Health and Welfare Criteria for Noise, changes in hearing levels of less than 5 dB are generally<br />
Page D-13