TITRE Adaptive Packet Video Streaming Over IP Networks - LaBRI
TITRE Adaptive Packet Video Streaming Over IP Networks - LaBRI
TITRE Adaptive Packet Video Streaming Over IP Networks - LaBRI

Create successful ePaper yourself
Turn your PDF publications into a flip-book with our unique Google optimized e-Paper software.
1<br />
MPEG-4 Based Layer Stream -AF11<br />
MPEG-4 Enhanced Layer Stream 1 -AF12<br />
MPEG-4 Enhanced Layer Stream 2 -AF13<br />
<strong>Packet</strong> Drop<br />
0.8<br />
% <strong>Packet</strong>s Dropped (100%)<br />
0.6<br />
0.4<br />
0.2<br />
0<br />
15 20 25 30 35 40 45 50 55 60<br />
Time (s)<br />
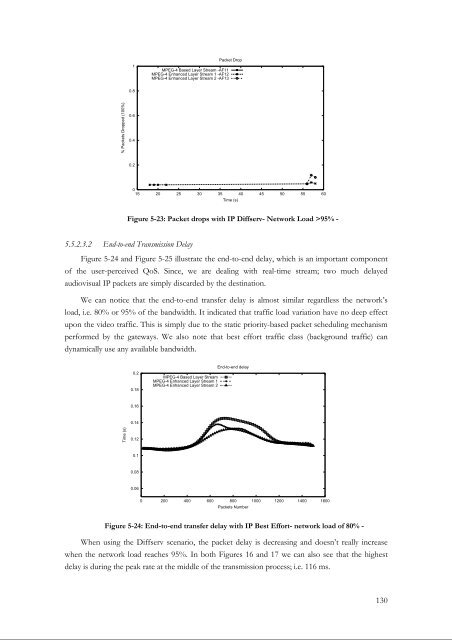
Figure 5-23: <strong>Packet</strong> drops with <strong>IP</strong> Diffserv- Network Load >95% -<br />
5.5.2.3.2 End-to-end Transmission Delay<br />
Figure 5-24 and Figure 5-25 illustrate the end-to-end delay, which is an important component<br />
of the user-perceived QoS. Since, we are dealing with real-time stream; two much delayed<br />
audiovisual <strong>IP</strong> packets are simply discarded by the destination.<br />
We can notice that the end-to-end transfer delay is almost similar regardless the network’s<br />
load, i.e. 80% or 95% of the bandwidth. It indicated that traffic load variation have no deep effect<br />
upon the video traffic. This is simply due to the static priority-based packet scheduling mechanism<br />
performed by the gateways. We also note that best effort traffic class (background traffic) can<br />
dynamically use any available bandwidth.<br />
0.2<br />
0.18<br />
MPEG-4 Based Layer Stream<br />
MPEG-4 Enhanced Layer Stream 1<br />
MPEG-4 Enhanced Layer Stream 2<br />
End-to-end delay<br />
0.16<br />
0.14<br />
Time (s)<br />
0.12<br />
0.1<br />
0.08<br />
0.06<br />
0 200 400 600 800 1000 1200 1400 1600<br />
<strong>Packet</strong>s Number<br />
Figure 5-24: End-to-end transfer delay with <strong>IP</strong> Best Effort- network load of 80% -<br />
When using the Diffserv scenario, the packet delay is decreasing and doesn’t really increase<br />
when the network load reaches 95%. In both Figures 16 and 17 we can also see that the highest<br />
delay is during the peak rate at the middle of the transmission process; i.e. 116 ms.<br />
130