TITRE Adaptive Packet Video Streaming Over IP Networks - LaBRI
TITRE Adaptive Packet Video Streaming Over IP Networks - LaBRI
TITRE Adaptive Packet Video Streaming Over IP Networks - LaBRI

Create successful ePaper yourself
Turn your PDF publications into a flip-book with our unique Google optimized e-Paper software.
We run our classification algorithm with the parameters described in the previous section, and<br />
we compute the output of each neuron. We choose the largest neuron output which reflects the<br />
high similarity. We choose also the value of λ<br />
1 k<br />
= λ2k<br />
= λ3k<br />
= 1 which connect each feature from the<br />
vector the network.<br />
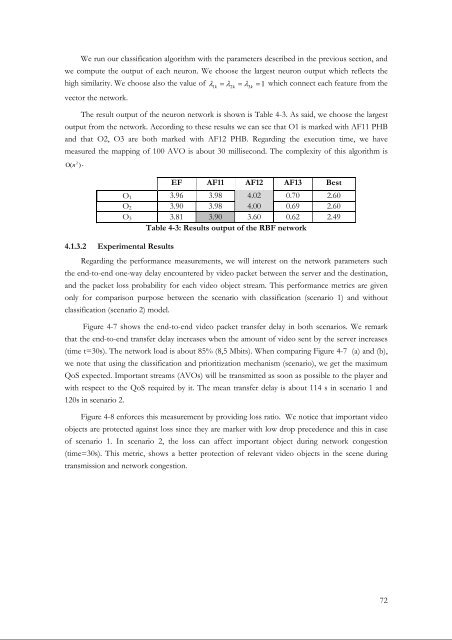
The result output of the neuron network is shown is Table 4-3. As said, we choose the largest<br />
output from the network. According to these results we can see that O1 is marked with AF11 PHB<br />
and that O2, O3 are both marked with AF12 PHB. Regarding the execution time, we have<br />
measured the mapping of 100 AVO is about 30 millisecond. The complexity of this algorithm is<br />
Ο ( n<br />
2 ) .<br />
EF AF11 AF12 AF13 Best<br />
O 1 3.96 3.98 4.02 0.70 2.60<br />
O 2 3.90 3.98 4.00 0.69 2.60<br />
O 3 3.81 3.90 3.60 0.62 2.49<br />
Table 4-3: Results output of the RBF network<br />
4.1.3.2 Experimental Results<br />
Regarding the performance measurements, we will interest on the network parameters such<br />
the end-to-end one-way delay encountered by video packet between the server and the destination,<br />
and the packet loss probability for each video object stream. This performance metrics are given<br />
only for comparison purpose between the scenario with classification (scenario 1) and without<br />
classification (scenario 2) model.<br />
Figure 4-7 shows the end-to-end video packet transfer delay in both scenarios. We remark<br />
that the end-to-end transfer delay increases when the amount of video sent by the server increases<br />
(time t=30s). The network load is about 85% (8,5 Mbits). When comparing Figure 4-7 (a) and (b),<br />
we note that using the classification and prioritization mechanism (scenario), we get the maximum<br />
QoS expected. Important streams (AVOs) will be transmitted as soon as possible to the player and<br />
with respect to the QoS required by it. The mean transfer delay is about 114 s in scenario 1 and<br />
120s in scenario 2.<br />
Figure 4-8 enforces this measurement by providing loss ratio. We notice that important video<br />
objects are protected against loss since they are marker with low drop precedence and this in case<br />
of scenario 1. In scenario 2, the loss can affect important object during network congestion<br />
(time=30s). This metric, shows a better protection of relevant video objects in the scene during<br />
transmission and network congestion.<br />
72