Tropical Storm Nicole - Planning Institute of Jamaica
Tropical Storm Nicole - Planning Institute of Jamaica
Tropical Storm Nicole - Planning Institute of Jamaica
You also want an ePaper? Increase the reach of your titles
YUMPU automatically turns print PDFs into web optimized ePapers that Google loves.
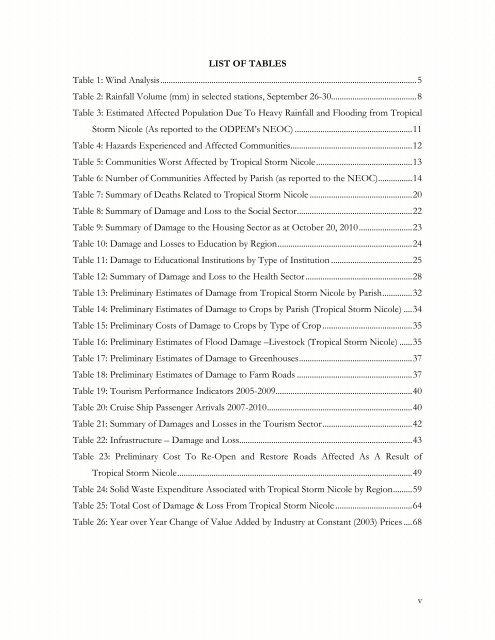
LIST OF TABLES<br />
Table 1: Wind Analysis ........................................................................................................................ 5<br />
Table 2: Rainfall Volume (mm) in selected stations, September 26-30........................................ 8<br />
Table 3: Estimated Affected Population Due To Heavy Rainfall and Flooding from <strong>Tropical</strong><br />
<strong>Storm</strong> <strong>Nicole</strong> (As reported to the ODPEM’s NEOC) ....................................................... 11<br />
Table 4: Hazards Experienced and Affected Communities......................................................... 12<br />
Table 5: Communities Worst Affected by <strong>Tropical</strong> <strong>Storm</strong> <strong>Nicole</strong> ............................................. 13<br />
Table 6: Number <strong>of</strong> Communities Affected by Parish (as reported to the NEOC)................ 14<br />
Table 7: Summary <strong>of</strong> Deaths Related to <strong>Tropical</strong> <strong>Storm</strong> <strong>Nicole</strong> ................................................ 20<br />
Table 8: Summary <strong>of</strong> Damage and Loss to the Social Sector ...................................................... 22<br />
Table 9: Summary <strong>of</strong> Damage to the Housing Sector as at October 20, 2010 ......................... 23<br />
Table 10: Damage and Losses to Education by Region ............................................................... 24<br />
Table 11: Damage to Educational Institutions by Type <strong>of</strong> Institution ...................................... 25<br />
Table 12: Summary <strong>of</strong> Damage and Loss to the Health Sector .................................................. 28<br />
Table 13: Preliminary Estimates <strong>of</strong> Damage from <strong>Tropical</strong> <strong>Storm</strong> <strong>Nicole</strong> by Parish .............. 32<br />
Table 14: Preliminary Estimates <strong>of</strong> Damage to Crops by Parish (<strong>Tropical</strong> <strong>Storm</strong> <strong>Nicole</strong>) .... 34<br />
Table 15: Preliminary Costs <strong>of</strong> Damage to Crops by Type <strong>of</strong> Crop .......................................... 35<br />
Table 16: Preliminary Estimates <strong>of</strong> Flood Damage –Livestock (<strong>Tropical</strong> <strong>Storm</strong> <strong>Nicole</strong>) ...... 35<br />
Table 17: Preliminary Estimates <strong>of</strong> Damage to Greenhouses ..................................................... 37<br />
Table 18: Preliminary Estimates <strong>of</strong> Damage to Farm Roads ...................................................... 37<br />
Table 19: Tourism Performance Indicators 2005-2009................................................................ 40<br />
Table 20: Cruise Ship Passenger Arrivals 2007-2010 .................................................................... 40<br />
Table 21: Summary <strong>of</strong> Damages and Losses in the Tourism Sector .......................................... 42<br />
Table 22: Infrastructure – Damage and Loss................................................................................. 43<br />
Table 23: Preliminary Cost To Re-Open and Restore Roads Affected As A Result <strong>of</strong><br />
<strong>Tropical</strong> <strong>Storm</strong> <strong>Nicole</strong> .............................................................................................................. 49<br />
Table 24: Solid Waste Expenditure Associated with <strong>Tropical</strong> <strong>Storm</strong> <strong>Nicole</strong> by Region ......... 59<br />
Table 25: Total Cost <strong>of</strong> Damage & Loss From <strong>Tropical</strong> <strong>Storm</strong> <strong>Nicole</strong> .................................... 64<br />
Table 26: Year over Year Change <strong>of</strong> Value Added by Industry at Constant (2003) Prices .... 68<br />
v


