Subsampling estimates of the Lasso distribution.
Subsampling estimates of the Lasso distribution.
Subsampling estimates of the Lasso distribution.

Create successful ePaper yourself
Turn your PDF publications into a flip-book with our unique Google optimized e-Paper software.
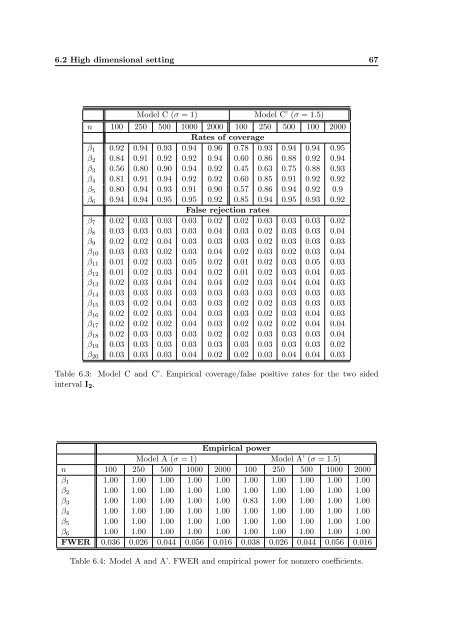
6.2 High dimensional setting 67<br />
Model C (σ = 1) Model C’ (σ = 1.5)<br />
n 100 250 500 1000 2000 100 250 500 100 2000<br />
Rates <strong>of</strong> coverage<br />
β 1 0.92 0.94 0.93 0.94 0.96 0.78 0.93 0.94 0.94 0.95<br />
β 2 0.84 0.91 0.92 0.92 0.94 0.60 0.86 0.88 0.92 0.94<br />
β 3 0.56 0.80 0.90 0.94 0.92 0.45 0.63 0.75 0.88 0.93<br />
β 4 0.81 0.91 0.94 0.92 0.92 0.60 0.85 0.91 0.92 0.92<br />
β 5 0.80 0.94 0.93 0.91 0.90 0.57 0.86 0.94 0.92 0.9<br />
β 6 0.94 0.94 0.95 0.95 0.92 0.85 0.94 0.95 0.93 0.92<br />
False rejection rates<br />
β 7 0.02 0.03 0.03 0.03 0.02 0.02 0.03 0.03 0.03 0.02<br />
β 8 0.03 0.03 0.03 0.03 0.04 0.03 0.02 0.03 0.03 0.04<br />
β 9 0.02 0.02 0.04 0.03 0.03 0.03 0.02 0.03 0.03 0.03<br />
β 10 0.03 0.03 0.02 0.03 0.04 0.02 0.03 0.02 0.03 0.04<br />
β 11 0.01 0.02 0.03 0.05 0.02 0.01 0.02 0.03 0.05 0.03<br />
β 12 0.01 0.02 0.03 0.04 0.02 0.01 0.02 0.03 0.04 0.03<br />
β 13 0.02 0.03 0.04 0.04 0.04 0.02 0.03 0.04 0.04 0.03<br />
β 14 0.03 0.03 0.03 0.03 0.03 0.03 0.03 0.03 0.03 0.03<br />
β 15 0.03 0.02 0.04 0.03 0.03 0.02 0.02 0.03 0.03 0.03<br />
β 16 0.02 0.02 0.03 0.04 0.03 0.03 0.02 0.03 0.04 0.03<br />
β 17 0.02 0.02 0.02 0.04 0.03 0.02 0.02 0.02 0.04 0.04<br />
β 18 0.02 0.03 0.03 0.03 0.02 0.02 0.03 0.03 0.03 0.04<br />
β 19 0.03 0.03 0.03 0.03 0.03 0.03 0.03 0.03 0.03 0.02<br />
β 20 0.03 0.03 0.03 0.04 0.02 0.02 0.03 0.04 0.04 0.03<br />
Table 6.3: Model C and C’. Empirical coverage/false positive rates for <strong>the</strong> two sided<br />
interval I 2 .<br />
Empirical power<br />
Model A (σ = 1) Model A’ (σ = 1.5)<br />
n 100 250 500 1000 2000 100 250 500 1000 2000<br />
β 1 1.00 1.00 1.00 1.00 1.00 1.00 1.00 1.00 1.00 1.00<br />
β 2 1.00 1.00 1.00 1.00 1.00 1.00 1.00 1.00 1.00 1.00<br />
β 3 1.00 1.00 1.00 1.00 1.00 0.83 1.00 1.00 1.00 1.00<br />
β 4 1.00 1.00 1.00 1.00 1.00 1.00 1.00 1.00 1.00 1.00<br />
β 5 1.00 1.00 1.00 1.00 1.00 1.00 1.00 1.00 1.00 1.00<br />
β 6 1.00 1.00 1.00 1.00 1.00 1.00 1.00 1.00 1.00 1.00<br />
FWER 0.036 0.026 0.044 0.056 0.016 0.038 0.026 0.044 0.056 0.016<br />
Table 6.4: Model A and A’. FWER and empirical power for nonzero coefficients.