Subsampling estimates of the Lasso distribution.
Subsampling estimates of the Lasso distribution.
Subsampling estimates of the Lasso distribution.

Create successful ePaper yourself
Turn your PDF publications into a flip-book with our unique Google optimized e-Paper software.
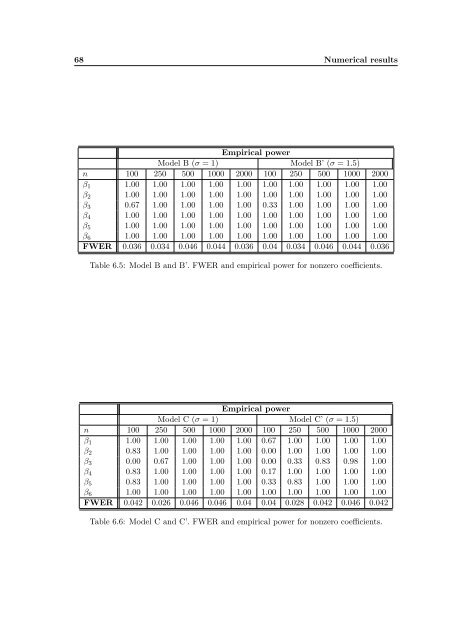
68 Numerical results<br />
Empirical power<br />
Model B (σ = 1) Model B’ (σ = 1.5)<br />
n 100 250 500 1000 2000 100 250 500 1000 2000<br />
β 1 1.00 1.00 1.00 1.00 1.00 1.00 1.00 1.00 1.00 1.00<br />
β 2 1.00 1.00 1.00 1.00 1.00 1.00 1.00 1.00 1.00 1.00<br />
β 3 0.67 1.00 1.00 1.00 1.00 0.33 1.00 1.00 1.00 1.00<br />
β 4 1.00 1.00 1.00 1.00 1.00 1.00 1.00 1.00 1.00 1.00<br />
β 5 1.00 1.00 1.00 1.00 1.00 1.00 1.00 1.00 1.00 1.00<br />
β 6 1.00 1.00 1.00 1.00 1.00 1.00 1.00 1.00 1.00 1.00<br />
FWER 0.036 0.034 0.046 0.044 0.036 0.04 0.034 0.046 0.044 0.036<br />
Table 6.5: Model B and B’. FWER and empirical power for nonzero coefficients.<br />
Empirical power<br />
Model C (σ = 1) Model C’ (σ = 1.5)<br />
n 100 250 500 1000 2000 100 250 500 1000 2000<br />
β 1 1.00 1.00 1.00 1.00 1.00 0.67 1.00 1.00 1.00 1.00<br />
β 2 0.83 1.00 1.00 1.00 1.00 0.00 1.00 1.00 1.00 1.00<br />
β 3 0.00 0.67 1.00 1.00 1.00 0.00 0.33 0.83 0.98 1.00<br />
β 4 0.83 1.00 1.00 1.00 1.00 0.17 1.00 1.00 1.00 1.00<br />
β 5 0.83 1.00 1.00 1.00 1.00 0.33 0.83 1.00 1.00 1.00<br />
β 6 1.00 1.00 1.00 1.00 1.00 1.00 1.00 1.00 1.00 1.00<br />
FWER 0.042 0.026 0.046 0.046 0.04 0.04 0.028 0.042 0.046 0.042<br />
Table 6.6: Model C and C’. FWER and empirical power for nonzero coefficients.