Questionnaire Dwelling Unit-Level and Person Pair-Level Sampling ...
Questionnaire Dwelling Unit-Level and Person Pair-Level Sampling ...
Questionnaire Dwelling Unit-Level and Person Pair-Level Sampling ...

Create successful ePaper yourself
Turn your PDF publications into a flip-book with our unique Google optimized e-Paper software.
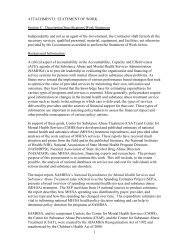
Exhibit H.1<br />
Definitions of <strong>Level</strong>s for <strong>Pair</strong>-<strong>Level</strong> Calibration Modeling Variables<br />
Group Quarter Indicator<br />
1: College Dorm, 2: Other Group Quarter, 3: Nongroup Quarter 1<br />
Household Size<br />
2: DU with 2 persons, 1 3: DU with 3 persons, 4: DU with ≥ 4 persons<br />
<strong>Pair</strong> Age (15 <strong>Level</strong>s)<br />
1: 12-17 <strong>and</strong> 12-17, 1 2: 12-17 <strong>and</strong> 18-25, 3: 12-17 <strong>and</strong> 26-34, 4: 12-17 <strong>and</strong> 35-49, 5: 12-17 <strong>and</strong> 50+,<br />
6: 18-25 <strong>and</strong> 18-25, 7: 18-25 <strong>and</strong> 26-34, 8: 18-25 <strong>and</strong> 35-49, 9: 18-25 <strong>and</strong> 50+, 10: 26-34 <strong>and</strong> 26-34,<br />
11: 26-34 <strong>and</strong> 35-49, 12: 26-34 <strong>and</strong> 50+, 13: 35-49 <strong>and</strong> 35-49, 14: 35-49 <strong>and</strong> 50+, 15: 50+ <strong>and</strong> 50+<br />
<strong>Pair</strong> Age (6 <strong>Level</strong>s)<br />
1: 12-17 <strong>and</strong> 12-17, 1 2: 12-17 <strong>and</strong> 18-25, 3: 12-17 <strong>and</strong> 26+, 4: 18-25 <strong>and</strong> 18-25, 5: 18-25 <strong>and</strong> 26+,<br />
6: 26+ <strong>and</strong> 26+<br />
<strong>Pair</strong> Age (3 <strong>Level</strong>s)<br />
1: 12-17 <strong>and</strong> 12-17, 1 2: 12-17 <strong>and</strong> 18+, 3: 18+ <strong>and</strong> 18+<br />
<strong>Pair</strong> Gender<br />
1: Male <strong>and</strong> Female, 1 2: Female <strong>and</strong> Female, 3: Male <strong>and</strong> Male<br />
<strong>Pair</strong> Race/Ethnicity (10 <strong>Level</strong>s)<br />
1: white <strong>and</strong> white, 1 2: white <strong>and</strong> black or African American, 3: white <strong>and</strong> Hispanic or Latino, 4: white <strong>and</strong> other,<br />
5: black or African American <strong>and</strong> black or African American, 6: black or African American <strong>and</strong> Hispanic or<br />
Latino, 7: black or African American <strong>and</strong> other, 8: Hispanic or Latino <strong>and</strong> Hispanic or Latino, 9: Hispanic or<br />
Latino <strong>and</strong> other, 10: other <strong>and</strong> other<br />
<strong>Pair</strong> Race/Ethnicity (5 <strong>Level</strong>s)<br />
1: Mixed race pair, 2: Hispanic or Latino pair, 3: black or African American pair, 4: white pair, 1 5: other pair<br />
<strong>Pair</strong> Race/Ethnicity (4 <strong>Level</strong>s)<br />
1: Mixed race pair or other <strong>and</strong> other, 2: Hispanic or Latino pair, 3: black or African American pair, 4: white pair 1<br />
Percentage of Owner-Occupied <strong>Dwelling</strong> <strong>Unit</strong>s in Segment (% Owner-Occupied)<br />
1: 50-100%, 1 2: 10->50%, 3: 0->10%<br />
Percentage of Segments That Are Black or African American (% Black)<br />
1: 50-100%, 2: 10->50%, 3: 0->10% 1<br />
Percentage of Segments That Are Hispanic or Latino (% Hispanic)<br />
1: 50-100%, 2: 10->50%, 3: 0->10% 1<br />
Segment-Combined Median Rent <strong>and</strong> Housing Value (Rent/Housing) 2<br />
1: First Quintile, 2: Second Quintile, 3: Third Quintile, 4: Fourth Quintile, 5: Fifth Quintile 1<br />
Population Density<br />
1: MSA 1,000,000 or more, 2: MSA less than 1,000,000, 3: Non-MSA urban, 4: Non-MSA rural 1<br />
Quarter<br />
1: Quarter 1, 2: Quarter 2, 3: Quarter 3, 4: Quarter 4 1<br />
Race/Ethnicity of Householder<br />
1: Hispanic or Latino white, 1 2: Hispanic or Latino black or African American, 3: Hispanic or Latino others,<br />
4: Non-Hispanic or Latino white, 5: Non-Hispanic or Latino black or African American, 6: Non-Hispanic or<br />
Latino others<br />
State/Region<br />
Model Group 1:<br />
Model Group 2:<br />
1: Connecticut, Maine, Massachusetts, New Hampshire, New Jersey, Rhode Isl<strong>and</strong>, Vermont;<br />
2: Alabama, Arkansas, Delaware, District of Columbia, Georgia, Kentucky, Louisiana,<br />
Maryl<strong>and</strong>, Mississippi, North Carolina, Oklahoma, South Carolina, Tennessee, Virginia, West<br />
Virginia; 1 3: New York; 4: Pennsylvania; 5: Florida; 6: Texas<br />
1: Indiana, Iowa, Kansas, Minnesota, Missouri, Nebraska, North Dakota, South Dakota,<br />
Wisconsin; 1 2: Alaska, Arizona, Colorado, Idaho, Hawaii, Montana, Nevada, New Mexico,<br />
Oregon, Utah, Washington, Wyoming; 3: Michigan; 4: Illinois; 5: Ohio; 6: California<br />
H-4