Questionnaire Dwelling Unit-Level and Person Pair-Level Sampling ...
Questionnaire Dwelling Unit-Level and Person Pair-Level Sampling ...
Questionnaire Dwelling Unit-Level and Person Pair-Level Sampling ...

Create successful ePaper yourself
Turn your PDF publications into a flip-book with our unique Google optimized e-Paper software.
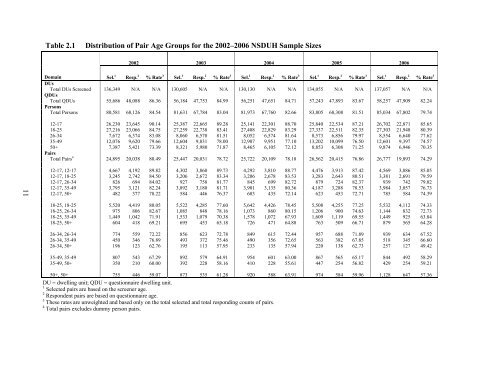
Table 2.1<br />
Distribution of <strong>Pair</strong> Age Groups for the 2002–2006 NSDUH Sample Sizes<br />
2002 2003 2004 2005 2006<br />
Domain Sel. 1 Resp. 2 % Rate 3 Sel. 1 Resp. 2 % Rate 3 Sel. 1 Resp. 2 % Rate 3 Sel. 1 Resp. 2 % Rate 3 Sel. 1 Resp. 2 % Rate 3<br />
DUs<br />
Total DUs Screened 136,349 N/A N/A 130,605 N/A N/A 130,130 N/A N/A 134,055 N/A N/A 137,057 N/A N/A<br />
QDUs<br />
Total QDUs 55,686 48,088 86.36 56,184 47,753 84.99 56,251 47,651 84.71 57,243 47,893 83.67 58,257 47,909 82.24<br />
<strong>Person</strong>s<br />
Total <strong>Person</strong>s 80,581 68,126 84.54 81,631 67,784 83.04 81,973 67,760 82.66 83,805 68,308 81.51 85,034 67,802 79.74<br />
12-17 26,230 23,645 90.14 25,387 22,665 89.28 25,141 22,301 88.70 25,840 22,534 87.21 26,702 22,871 85.65<br />
18-25 27,216 23,066 84.75 27,259 22,738 83.41 27,408 22,829 83.29 27,337 22,511 82.35 27,303 21,948 80.39<br />
26-34 7,672 6,374 83.08 8,060 6,570 81.51 8,052 6,574 81.64 8,573 6,856 79.97 8,554 6,640 77.62<br />
35-49 12,076 9,620 79.66 12,604 9,831 78.00 12,907 9,951 77.10 13,202 10,099 76.50 12,601 9,397 74.57<br />
50+ 7,387 5,421 73.39 8,321 5,980 71.87 8,465 6,105 72.12 8,853 6,308 71.25 9,874 6,946 70.35<br />
<strong>Pair</strong>s<br />
Total <strong>Pair</strong>s 4 24,895 20,038 80.49 25,447 20,031 78.72 25,722 20,109 78.18 26,562 20,415 76.86 26,777 19,893 74.29<br />
11<br />
12-17, 12-17 4,667 4,192 89.82 4,302 3,860 89.73 4,292 3,810 88.77 4,476 3,913 87.42 4,569 3,886 85.05<br />
12-17, 18-25 3,245 2,742 84.50 3,206 2,672 83.34 3,206 2,678 83.53 3,283 2,643 80.51 3,381 2,691 79.59<br />
12-17, 26-34 826 694 84.02 927 758 81.77 845 699 82.72 879 724 82.37 939 742 79.02<br />
12-17, 35-49 3,795 3,121 82.24 3,892 3,180 81.71 3,901 3,135 80.36 4,187 3,288 78.53 3,984 3,057 76.73<br />
12-17, 50+ 482 377 78.22 584 446 76.37 603 435 72.14 623 453 72.71 785 584 74.39<br />
18-25, 18-25 5,520 4,419 80.05 5,522 4,285 77.60 5,642 4,426 78.45 5,508 4,255 77.25 5,532 4,112 74.33<br />
18-25, 26-34 975 806 82.67 1,085 848 78.16 1,073 860 80.15 1,206 900 74.63 1,144 832 72.73<br />
18-25, 35-49 1,449 1,042 71.91 1,533 1,079 70.38 1,578 1,072 67.93 1,609 1,119 69.55 1,449 925 63.84<br />
18-25, 50+ 604 418 69.21 695 453 65.18 726 471 64.88 763 509 66.71 879 565 64.28<br />
26-34, 26-34 774 559 72.22 856 623 72.78 849 615 72.44 957 688 71.89 939 634 67.52<br />
26-34, 35-49 450 346 76.89 493 372 75.46 490 356 72.65 563 382 67.85 518 345 66.60<br />
26-34, 50+ 196 123 62.76 195 113 57.95 233 135 57.94 220 138 62.73 257 127 49.42<br />
35-49, 35-49 807 543 67.29 892 579 64.91 954 601 63.00 867 565 65.17 844 492 58.29<br />
35-49, 50+ 350 210 60.00 392 228 58.16 410 228 55.61 447 254 56.82 429 254 59.21<br />
50+, 50+ 755 446 59.07 873 535 61.28 920 588 63.91 974 584 59.96 1,128 647 57.36<br />
DU = dwelling unit; QDU = questionnaire dwelling unit.<br />
1 Selected pairs are based on the screener age.<br />
2 Respondent pairs are based on questionnaire age.<br />
3 These rates are unweighted <strong>and</strong> based only on the total selected <strong>and</strong> total responding counts of pairs.<br />
4 Total pairs excludes dummy person pairs.