L-2
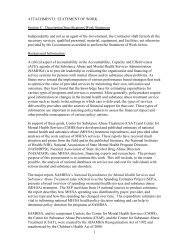
L-3 Table L.1 2006 NSDUH Selected <strong>Pair</strong>-<strong>Level</strong> Weight Summary Statistics SDU-<strong>Level</strong> Weights 1 (SDUWT: YR06WT1*...*YR06WT9) Before sel.pr.ps 1 (SDUWT*PR06WT10) After sel.pr.ps 1 (SDUWT*PR06WT10*PR06WT11) Domain n Min Q1 2 Med Q3 2 Max UWE 3 Min Q1 2 Med Q3 2 Max UWE 3 Min Q1 2 Med Q3 2 Max UWE 3 Total 26,777 20 480 733 1,204 7,441 1.46 27 1,111 2,847 7,707 3,069,164 20.47 13 1,059 2,891 7,418 1,453,190 11.75 <strong>Pair</strong> Age Group 12-17, 12-17 4,569 22 412 665 1,067 5,339 1.49 27 644 1,052 1,936 94,302 2.99 13 569 1,095 2,148 26,775 2.28 12-17, 18-25 3,381 20 516 751 1,230 6,067 1.44 27 812 1,340 2,520 54,010 2.82 22 801 1,561 3,026 18,964 1.95 12-17, 26-34 939 28 491 742 1,203 6,060 1.46 148 2,452 4,039 6,741 91,189 2.34 136 2,058 3,751 6,997 90,345 2.35 12-17, 35-49 3,984 32 483 678 1,125 5,667 1.45 174 3,176 5,598 9,426 105,226 2.19 95 2,785 5,197 9,967 108,761 2.28 12-17, 50+ 785 23 496 755 1,197 7,441 1.49 265 5,917 9,641 15,640 229,862 2.42 306 4,987 8,985 15,713 165,702 2.28 18-25, 18-25 5,532 26 446 789 1,276 5,518 1.44 48 769 1,320 2,360 126,968 3.89 27 555 1,219 2,913 35,688 2.44 18-25, 26-34 1,144 31 472 800 1,335 4,733 1.47 171 2,510 4,177 6,837 153,180 3.07 102 1,517 3,201 6,873 104,283 3.06 18-25, 35-49 1,449 34 538 772 1,276 4,053 1.40 185 3,562 6,660 12,051 415,236 3.67 199 3,215 6,910 14,567 123,098 2.28 18-25, 50+ 879 60 563 837 1,344 4,191 1.39 803 6,465 10,350 17,509 275,300 2.53 307 5,755 10,127 19,412 147,050 2.22 26-34, 26-34 939 56 523 781 1,296 4,626 1.45 624 4,388 7,137 11,771 220,827 2.95 343 3,256 5,535 10,980 389,183 5.54 26-34, 35-49 518 67 521 742 1,294 4,335 1.45 1,014 5,242 8,518 14,698 1,173,772 16.74 314 3,621 6,132 13,315 563,775 9.04 26-34, 50+ 257 77 607 845 1,291 3,289 1.39 1,533 11,806 18,834 31,281 1,292,083 8.84 919 7,117 16,192 31,018 757,765 5.60 35-49, 35-49 844 20 515 675 1,115 6,786 1.53 222 6,039 8,778 14,572 788,361 8.61 249 5,697 10,359 19,554 1,027,245 9.82 35-49, 50+ 429 51 556 789 1,300 3,661 1.43 880 9,846 17,144 30,312 2,481,678 15.83 674 7,057 16,314 33,910 1,022,837 6.75 50+, 50+ 1,128 61 492 708 1,159 3,140 1.39 1,870 12,378 17,711 29,892 3,069,164 14.06 1,309 11,691 19,416 31,785 1,453,190 5.30 <strong>Pair</strong> Race/Ethnicity Hispanic or 3,691 20 485 876 1,385 6,786 1.49 27 1,235 3,118 8,183 1,173,772 14.56 21 1,191 3,120 7,558 792,439 11.95 Latino Black or 2,817 34 613 868 1,276 5,064 1.38 70 1,269 3,109 7,606 275,300 4.39 32 1,340 3,099 7,779 236,371 4.94 African American White 16,859 32 501 708 1,120 3,763 1.38 52 1,104 2,835 7,637 3,069,164 27.85 23 1,040 2,842 7,289 1,453,190 14.38 Other 1,519 25 214 557 1,313 7,441 1.88 39 738 2,190 7,555 241,882 5.78 13 742 2,396 7,763 358,615 6.59 White & Black 219 32 604 871 1,322 3,515 1.33 44 1,540 3,110 7,414 146,682 5.20 40 1,313 4,083 8,843 97,257 3.56 or African American White & 773 24 428 802 1,292 6,632 1.51 52 1,194 3,353 8,784 237,704 4.78 36 872 3,146 8,210 349,882 7.67 Hispanic or Latino White & Other 614 30 249 556 1,112 4,589 1.80 33 899 2,326 6,727 415,236 9.76 34 775 2,080 6,368 289,018 7.22 Black or 88 57 437 838 1,377 5,518 1.79 140 1,142 3,515 8,583 87,149 3.48 93 2,211 4,307 13,604 97,256 3.08 African American & Hispanic or Latino Black or 88 26 276 539 1,066 3,459 1.83 42 794 1,813 7,223 27,665 2.59 15 702 2,283 8,276 50,067 3.13 African American & Other Hispanic or Latino & Other 109 23 160 421 1,131 4,321 2.09 37 560 1,359 2,974 43,004 3.94 22 691 2,231 5,976 95,812 4.48
- Page 1 and 2:
2006 NATIONAL SURVEY ON DRUG USE AN
- Page 3 and 4:
Preface This report documents the m
- Page 5 and 6:
Table of Contents Chapter Page Pref
- Page 7 and 8:
Table of Contents (continued) Appen
- Page 9 and 10:
List of Tables Table Page Table 1.1
- Page 11 and 12:
List of Tables (continued) Table Pa
- Page 13 and 14:
List of Exhibits Exhibit Page Exhib
- Page 15 and 16:
CBSA DU ev GEM Half step Household-
- Page 17 and 18:
1. Introduction Traditionally, most
- Page 19 and 20:
produced a priori. It was anticipat
- Page 21:
to perform some treatment (such as
- Page 24 and 25:
P hij ( ) ⎡P P ⎤⎡ 1 1 ⎤ hi
- Page 26 and 27:
The QDU selection probability was d
- Page 29 and 30:
3. Brief Description of the General
- Page 31 and 32:
4. Predictor Variables for the Ques
- Page 33 and 34:
Exhibit 4.1 Definitions of Levels f
- Page 35:
Exhibit 4.2 Definitions of Levels f
- Page 38 and 39:
e. Youth Only; f. Young Adult Only;
- Page 41 and 42:
6. Editing and Imputation of Pair R
- Page 43 and 44:
from other pair members was sometim
- Page 45 and 46:
Table 6.1 Levels of the Variable PA
- Page 47 and 48:
Table 6.3 Measures of the Quality o
- Page 49 and 50:
identified pair member "A" as "othe
- Page 51 and 52:
performed at the household level ra
- Page 53 and 54:
pair member's roster and another pa
- Page 55 and 56:
Table 6.6 Age Group Pair Number Age
- Page 57 and 58:
13. MSA (metropolitan statistical a
- Page 59 and 60:
different ways depending upon the a
- Page 61 and 62:
5. parent-child (child 12 to 17), p
- Page 63 and 64:
ecause, even though the parent-chil
- Page 65 and 66:
collapsed with the two-parent house
- Page 67 and 68:
Sibling-sibling pairs. The likeness
- Page 69 and 70:
with children) lived within the hou
- Page 71 and 72:
6.4.1.2 Sibling-Sibling Domains Whe
- Page 73 and 74:
4. The respondent had a child and a
- Page 75 and 76:
parent-focus and child-focus counts
- Page 77 and 78:
the random imputation described ear
- Page 79 and 80:
6.4.3.3.3 Spouse-Spouse Counts For
- Page 81 and 82:
7. Weight Calibration at Questionna
- Page 83 and 84:
Exhibit 7.2 Summary of 2006 NSDUH P
- Page 85 and 86:
Table 7.1 Model Group QDU Sample Si
- Page 87 and 88:
7.2.5 QDU Weight Component #15: Res
- Page 89 and 90:
8. Evaluation of Calibration Weight
- Page 91 and 92:
8.5 Sensitivity Analysis of Drug Us
- Page 93 and 94:
Table 8.2a Percentages of Youths (1
- Page 95 and 96:
Table 8.3a Percentages of Youths (1
- Page 97 and 98:
Table 8.4 Percentages of Youths (12
- Page 99 and 100:
Table 8.6a Percentages of Youths (1
- Page 101 and 102:
Table 8.7a Percentages of Youths (1
- Page 103 and 104:
References Ault, K., Aldworth, J.,
- Page 105:
Singh, A., Grau, E., & Folsom, R.,
- Page 108 and 109:
A-2
- Page 110 and 111:
A.2 GEM Adjustments for Extreme-Val
- Page 112 and 113:
A-6
- Page 114 and 115:
B-2
- Page 116 and 117:
B.1.1 Person Level B.1.1.1 Receivin
- Page 118 and 119:
B-6
- Page 120 and 121:
C-2
- Page 122 and 123:
To help understand what effects wer
- Page 124 and 125:
Exhibit C.1 Definitions of Levels f
- Page 126 and 127:
C.3 How to Interpret Collapsing and
- Page 128 and 129:
The number of respondents in that c
- Page 130 and 131:
Exhibit C.2 Covariates for 2006 NSD
- Page 132 and 133:
C-14
- Page 134 and 135:
Table C.1b 2006 Distribution of Wei
- Page 136 and 137:
Exhibit C.1.1 Covariates for 2006 N
- Page 138 and 139:
Exhibit C.1.3 Covariates for 2006 N
- Page 140 and 141:
C-22
- Page 142 and 143:
Table C.2b 2006 Distribution of Wei
- Page 144 and 145:
Exhibit C.2.1 Covariates for 2006 N
- Page 146 and 147:
Exhibit C.2.3 Covariates for 2006 N
- Page 148 and 149:
C-30
- Page 150 and 151:
Table C.3b 2006 Distribution of Wei
- Page 152 and 153:
Exhibit C.3.1 Covariates for 2006 N
- Page 154 and 155:
Exhibit C.3.3 Covariates for 2006 N
- Page 156 and 157:
C-38
- Page 158 and 159:
Table C.4b 2006 Distribution of Wei
- Page 160 and 161:
Exhibit C.4.1 Covariates for 2006 N
- Page 162 and 163:
Exhibit C.4.3 Covariates for 2006 N
- Page 164 and 165:
D-2
- Page 166 and 167:
D-4
- Page 168 and 169:
E-2
- Page 170 and 171:
E-4 Table E.1 2006 NSDUH Selected Q
- Page 172 and 173:
E-6 Table E.2 2006 NSDUH Respondent
- Page 174 and 175:
F-2
- Page 176 and 177:
Table F.1 2006 NSDUH QDU-Level Slip
- Page 178 and 179: G-2
- Page 180 and 181: G-4 Table G.1 2006 NSDUH Selected Q
- Page 182 and 183: G-6 Table G.2 2006 NSDUH Respondent
- Page 184 and 185: H-2
- Page 186 and 187: Exhibit H.1 Definitions of Levels f
- Page 188 and 189: Exhibit H.2 Covariates for 2006 NSD
- Page 190 and 191: H-8
- Page 192 and 193: Table H.1b 2006 Distribution of Wei
- Page 194 and 195: Exhibit H.1.1 Covariates for 2006 N
- Page 196 and 197: Exhibit H.1.3 Covariates for 2006 N
- Page 198 and 199: H-16
- Page 200 and 201: H-18
- Page 202 and 203: Table H.2b 2006 Pair Weight GEM Mod
- Page 204 and 205: Exhibit H.2.1 Covariates for 2006 N
- Page 206 and 207: Exhibit H.2.3 Covariates for 2006 N
- Page 208 and 209: H-26
- Page 210 and 211: I-2
- Page 212 and 213: Table I.1 2006 NSDUH Person Pair-Le
- Page 214 and 215: J-2
- Page 216 and 217: J-4 Table J.1 Domain 2006 NSDUH Sel
- Page 218 and 219: J-6 Table J.2 2006 NSDUH Respondent
- Page 220 and 221: J-8 Table J.3 Domain 2006 NSDUH Res
- Page 222 and 223: J-10
- Page 224 and 225: K-2
- Page 226 and 227: Table K.1 2006 NSDUH Respondent Pai
- Page 230 and 231: L-4 Table L.1 2006 NSDUH Selected P
- Page 232 and 233: L-6 Table L.2 2006 NSDUH Respondent
- Page 234 and 235: L-8 Table L.3 2006 NSDUH Respondent
- Page 236 and 237: L-10 Table L.3 2006 NSDUH Responden
- Page 238 and 239: M-2
- Page 240 and 241: procedures were implemented indepen
- Page 242 and 243: first sorting variables). In genera
- Page 244 and 245: predicted mean(s), the neighborhood
- Page 246 and 247: N-2
- Page 248 and 249: The PMM method is only applicable t
- Page 250 and 251: type of constraint, called a "logic
- Page 252 and 253: N-8
- Page 254 and 255: O-2
- Page 256 and 257: Table O.1 Rules for Determining Mat
- Page 258 and 259: Table O.1 Rules for Determining Mat
- Page 260 and 261: O-8 Table O.2 Priority Condition Ru
- Page 262 and 263: O-10 Table O.2 Priority Condition 2
- Page 264 and 265: Table O.2 Priority Condition Rules
- Page 266 and 267: O-14 Table O.2 Priority Condition 5
- Page 268 and 269: O-16 Table O.2 Priority Condition 6
- Page 270 and 271: P-2
- Page 272 and 273: P-4 Table P.1 Priority Condition, F
- Page 274 and 275: Table P.1 Priority Conditions Used
- Page 276 and 277: P-8 Table P.1 Priority Condition, F
- Page 278 and 279:
P-10 Table P.2 Priority Condition,
- Page 280 and 281:
P-12 Table P.2 Priority Condition,
- Page 282 and 283:
P-14 Table P.2 Priority Condition,
- Page 284 and 285:
P-16 Table P.2 Priority Condition,
- Page 286 and 287:
P-18
- Page 288 and 289:
Q-2
- Page 290 and 291:
data, which was adjusted to more re
- Page 292 and 293:
Table Q.1 Model Group 3 (15-17, 15-
- Page 294 and 295:
Table Q.1 Model Group 9 (18-20, 26+
- Page 296 and 297:
Table Q.2 Pair Domain Sibling (12-1
- Page 298 and 299:
Table Q.3 Model Group Parent- Child
- Page 300 and 301:
Table Q.3 Pair Domain Spouse- Spous
- Page 302 and 303:
Table Q.4 Pair Domain Sibling (12-1
- Page 304 and 305:
Q-18
- Page 306 and 307:
R-2
- Page 308 and 309:
was not imputed, the indirect count
- Page 310 and 311:
1. The counts disagreed if a househ
- Page 312 and 313:
S-2
- Page 314 and 315:
with parent(s) in the household) fo
- Page 316 and 317:
• Both had counts of children wit
- Page 318 and 319:
− The other conditions had not al
- Page 320 and 321:
• The number of children in the s
- Page 322 and 323:
5. Two family units might be in the
- Page 324 and 325:
− − No bad relationship codes i
- Page 326 and 327:
elationship codes, and the sum of t
- Page 328 and 329:
• The pair relationship was not a
- Page 330 and 331:
• The screener count of roster me
- Page 332 and 333:
15. The count of the number of spou
- Page 334 and 335:
member had a spouse-spouse-with-chi
- Page 336 and 337:
• If the spouse-spouse counts exc
- Page 338:
• The number of roster members yo