Questionnaire Dwelling Unit-Level and Person Pair-Level Sampling ...
Questionnaire Dwelling Unit-Level and Person Pair-Level Sampling ...
Questionnaire Dwelling Unit-Level and Person Pair-Level Sampling ...

Create successful ePaper yourself
Turn your PDF publications into a flip-book with our unique Google optimized e-Paper software.
pair member's roster <strong>and</strong> another pair member's interview age <strong>and</strong> gender <strong>and</strong> the ages did not<br />
match exactly.<br />
If no roster ages were missing, the sum of these counts was equal to the edited household<br />
size, TOTPEOP. Note that the raw household size was not considered here, since the counts were<br />
obtained from an edited roster. As with household size, a series of if-then-else conditions were<br />
used to obtain the most likely count within each age group. These conditions are called priority<br />
conditions due to their hierarchical nature. If the appropriate count was ambiguous due to<br />
disagreement between the pair members, the quality of the roster <strong>and</strong> the age of the respondent<br />
(in that order) were used to determine the appropriate count. The roster quality was determined<br />
by the number of bad or missing roster entries (as indicated in the previous section) <strong>and</strong> the<br />
quality of the match between the pair member's roster <strong>and</strong> the other pair member's questionnaire<br />
age <strong>and</strong> gender. If only one household member was selected as a respondent, the rules were the<br />
same as when two household members were selected in a pair, but only one of the pair members<br />
had nonmissing data for the roster ages, with one important exception. When determining<br />
minimum possible counts for various age groups, it was obviously not necessary to incorporate<br />
information from another pair member to increment the minimum for that pair member. General<br />
points about the creation of the age variables are provided in Appendix P.<br />
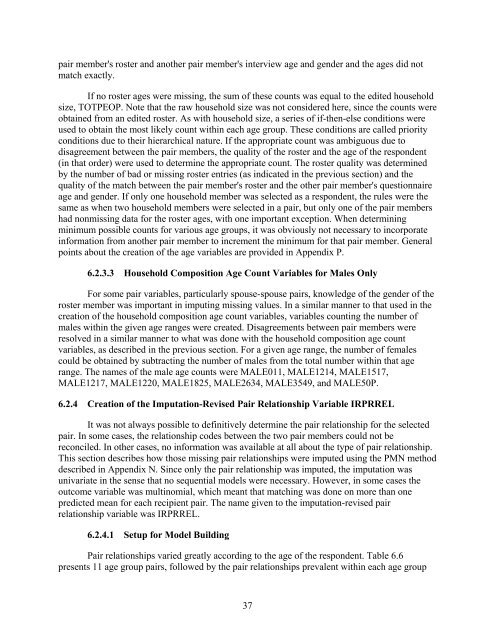
6.2.3.3 Household Composition Age Count Variables for Males Only<br />
For some pair variables, particularly spouse-spouse pairs, knowledge of the gender of the<br />
roster member was important in imputing missing values. In a similar manner to that used in the<br />
creation of the household composition age count variables, variables counting the number of<br />
males within the given age ranges were created. Disagreements between pair members were<br />
resolved in a similar manner to what was done with the household composition age count<br />
variables, as described in the previous section. For a given age range, the number of females<br />
could be obtained by subtracting the number of males from the total number within that age<br />
range. The names of the male age counts were MALE011, MALE1214, MALE1517,<br />
MALE1217, MALE1220, MALE1825, MALE2634, MALE3549, <strong>and</strong> MALE50P.<br />
6.2.4 Creation of the Imputation-Revised <strong>Pair</strong> Relationship Variable IRPRREL<br />
It was not always possible to definitively determine the pair relationship for the selected<br />
pair. In some cases, the relationship codes between the two pair members could not be<br />
reconciled. In other cases, no information was available at all about the type of pair relationship.<br />
This section describes how those missing pair relationships were imputed using the PMN method<br />
described in Appendix N. Since only the pair relationship was imputed, the imputation was<br />
univariate in the sense that no sequential models were necessary. However, in some cases the<br />
outcome variable was multinomial, which meant that matching was done on more than one<br />
predicted mean for each recipient pair. The name given to the imputation-revised pair<br />
relationship variable was IRPRREL.<br />
6.2.4.1 Setup for Model Building<br />
<strong>Pair</strong> relationships varied greatly according to the age of the respondent. Table 6.6<br />
presents 11 age group pairs, followed by the pair relationships prevalent within each age group<br />
37