Bioenergy Implementation Plan - South-East Regional Authority
Bioenergy Implementation Plan - South-East Regional Authority
Bioenergy Implementation Plan - South-East Regional Authority

You also want an ePaper? Increase the reach of your titles
YUMPU automatically turns print PDFs into web optimized ePapers that Google loves.
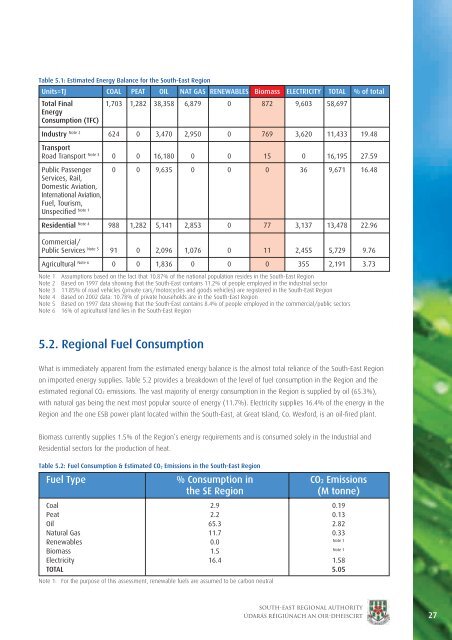
Table 5.1: Estimated Energy Balance for the <strong>South</strong>-<strong>East</strong> Region<br />
Units=TJ COAL PEAT OIL NAT GAS RENEWABLES Biomass ELECTRICITY TOTAL % of total<br />
Total Final 1,703 1,282 38,358 6,879 0 872 9,603 58,697<br />
Energy<br />
Consumption (TFC)<br />
Industry Note 2 624 0 3,470 2,950 0 769 3,620 11,433 19.48<br />
Transport<br />
Road Transport Note 3 0 0 16,180 0 0 15 0 16,195 27.59<br />
Public Passenger 0 0 9,635 0 0 0 36 9,671 16.48<br />
Services, Rail,<br />
Domestic Aviation,<br />
International Aviation,<br />
Fuel, Tourism,<br />
Unspecified Note 1<br />
Residential Note 4 988 1,282 5,141 2,853 0 77 3,137 13,478 22.96<br />
Commercial/<br />
Public Services Note 5 91 0 2,096 1,076 0 11 2,455 5,729 9.76<br />
Agricultural Note 6 0 0 1,836 0 0 0 355 2,191 3.73<br />
Note 1<br />
Note 2<br />
Note 3<br />
Note 4<br />
Note 5<br />
Note 6<br />
Assumptions based on the fact that 10.87% of the national population resides in the <strong>South</strong>-<strong>East</strong> Region<br />
Based on 1997 data showing that the <strong>South</strong>-<strong>East</strong> contains 11.2% of people employed in the industrial sector<br />
11.85% of road vehicles (private cars/motorcycles and goods vehicles) are registered in the <strong>South</strong>-<strong>East</strong> Region<br />
Based on 2002 data: 10.78% of private households are in the <strong>South</strong>-<strong>East</strong> Region<br />
Based on 1997 data showing that the <strong>South</strong>-<strong>East</strong> contains 8.4% of people employed in the commercial/public sectors<br />
16% of agricultural land lies in the <strong>South</strong>-<strong>East</strong> Region<br />
5.2. <strong>Regional</strong> Fuel Consumption<br />
What is immediately apparent from the estimated energy balance is the almost total reliance of the <strong>South</strong>-<strong>East</strong> Region<br />
on imported energy supplies. Table 5.2 provides a breakdown of the level of fuel consumption in the Region and the<br />
estimated regional CO2 emissions. The vast majority of energy consumption in the Region is supplied by oil (65.3%),<br />
with natural gas being the next most popular source of energy (11.7%). Electricity supplies 16.4% of the energy in the<br />
Region and the one ESB power plant located within the <strong>South</strong>-<strong>East</strong>, at Great Island, Co. Wexford, is an oil-fired plant.<br />
Biomass currently supplies 1.5% of the Region’s energy requirements and is consumed solely in the Industrial and<br />
Residential sectors for the production of heat.<br />
Table 5.2: Fuel Consumption & Estimated CO 2 Emissions in the <strong>South</strong>-<strong>East</strong> Region<br />
Fuel Type % Consumption in CO2 Emissions<br />
the SE Region<br />
(M tonne)<br />
Coal 2.9 0.19<br />
Peat 2.2 0.13<br />
Oil 65.3 2.82<br />
Natural Gas 11.7 0.33<br />
Renewables 0.0<br />
Note 1<br />
Biomass 1.5<br />
Note 1<br />
Electricity 16.4 1.58<br />
TOTAL 5.05<br />
Note 1:<br />
For the purpose of this assessment, renewable fuels are assumed to be carbon neutral<br />
south-east regional authority<br />
údarás réigiúnach an Oir-DheisCIrt<br />
27