![PDF [4833KB] - Sony](https://img.yumpu.com/26420643/102/500x640/pdf-4833kb-sony.jpg)
PDF [4833KB] - Sony
PDF [4833KB] - Sony
PDF [4833KB] - Sony

You also want an ePaper? Increase the reach of your titles
YUMPU automatically turns print PDFs into web optimized ePapers that Google loves.
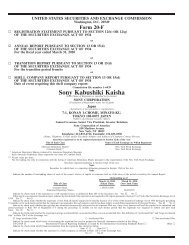
Consolidated Statements of Cash Flows<br />
<strong>Sony</strong> Corporation and Consolidated Subsidiaries – Year ended March 31<br />
Dollars in millions<br />
Yen in millions (Note 3)<br />
2002 2003 2004 2004<br />
Cash flows from operating activities:<br />
Net income . . . . . . . . . . . . . . . . . . . . . . . . . . . . . . . . . . . . . . . . . . . . . . . . . . . ¥ 15,310 ¥115,519 ¥ 88,511 $ 851<br />
Adjustments to reconcile net income to net cash provided by operating activities—<br />
Depreciation and amortization, including amortization of deferred insurance<br />
acquisition costs . . . . . . . . . . . . . . . . . . . . . . . . . . . . . . . . . . . . . . . . . . . . . 354,135 351,925 366,269 3,522<br />
Amortization of film costs . . . . . . . . . . . . . . . . . . . . . . . . . . . . . . . . . . . . . . . 242,614 312,054 305,786 2,940<br />
Accrual for pension and severance costs, less payments. . . . . . . . . . . . . . . . 14,995 37,858 35,562 342<br />
Loss on sale, disposal or impairment of assets, net (Notes 9 and 17) . . . . . . 49,862 39,941 35,495 341<br />
Gain on sales of securities investments, net (Notes 6 and 7). . . . . . . . . . . . . (1,398) (72,552) (11,774) (113)<br />
Gain on issuances of stock by subsidiaries and equity investees (Note 19) . . (503) – (4,870) (47)<br />
Deferred income taxes. . . . . . . . . . . . . . . . . . . . . . . . . . . . . . . . . . . . . . . . . . (49,719) (98,016) (34,445) (331)<br />
Equity in net income of affiliated companies, net of dividends . . . . . . . . . . . 37,537 46,692 1,732 17<br />
Cumulative effect of accounting changes (Note 2). . . . . . . . . . . . . . . . . . . . (5,978) – 2,117 20<br />
Changes in assets and liabilities:<br />
(Increase) decrease in notes and accounts receivable, trade . . . . . . . . . . . 111,301 174,679 (63,010) (606)<br />
(Increase) decrease in inventories . . . . . . . . . . . . . . . . . . . . . . . . . . . . . . . 290,872 36,039 (78,656) (756)<br />
Increase in film costs . . . . . . . . . . . . . . . . . . . . . . . . . . . . . . . . . . . . . . . . . (236,072) (317,953) (299,843) (2,883)<br />
Increase (decrease) in notes and accounts payable, trade . . . . . . . . . . . . . (172,626) (58,384) 93,950 903<br />
Increase (decrease) in accrued income and other taxes . . . . . . . . . . . . . . . (39,589) 14,637 (46,067) (443)<br />
Increase in future insurance policy benefits and other . . . . . . . . . . . . . . . 314,405 233,992 264,216 2,541<br />
Increase in deferred insurance acquisition costs . . . . . . . . . . . . . . . . . . . . (71,522) (66,091) (71,219) (685)<br />
Increase in marketable securities held in the insurance business<br />
for trading purpose . . . . . . . . . . . . . . . . . . . . . . . . . . . . . . . . . . . . . . . . . (55,661) – – –<br />
(Increase) decrease in other current assets . . . . . . . . . . . . . . . . . . . . . . . . 5,543 29,095 (34,991) (336)<br />
Increase (decrease) in other current liabilities . . . . . . . . . . . . . . . . . . . . . . (19,418) 26,205 44,772 431<br />
Other . . . . . . . . . . . . . . . . . . . . . . . . . . . . . . . . . . . . . . . . . . . . . . . . . . . . . (46,492) 48,148 39,100 375<br />
Net cash provided by operating activities . . . . . . . . . . . . . . . . . . . . . . . ¥737,596 ¥853,788 ¥632,635 $6,083<br />
(Continued on following page.)<br />
100