![PDF [4833KB] - Sony](https://img.yumpu.com/26420643/71/500x640/pdf-4833kb-sony.jpg)
PDF [4833KB] - Sony
PDF [4833KB] - Sony
PDF [4833KB] - Sony

You also want an ePaper? Increase the reach of your titles
YUMPU automatically turns print PDFs into web optimized ePapers that Google loves.
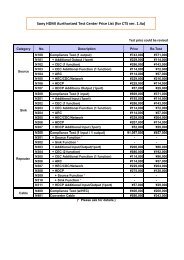
Revenue and operating income in the Financial<br />
Services segment<br />
(Billion ¥) (Billion ¥)<br />
1,200<br />
1,000<br />
800<br />
600<br />
400<br />
200<br />
0<br />
4.3% 4.2%<br />
02 03 04<br />
Financial Services revenue (left)<br />
Operating income (right)<br />
Operating margin<br />
* Year ended March 31<br />
9.3%<br />
300<br />
200<br />
100<br />
–100<br />
rate account and the general account, reflecting<br />
strength in the equity markets. This increase occurred<br />
despite a 30.8 billion yen reduction in<br />
revenue resulting from a change in the method<br />
of recognizing insurance premiums received on<br />
certain products from being recorded as revenues<br />
to being offset against the related provision<br />
for future insurance policy benefits since<br />
the third quarter beginning October 1, 2003.<br />
Insurance revenue decreased as a result of this<br />
change in method of recording revenue but the<br />
actual life insurance business remained strong<br />
as new insurance sales increased compared<br />
with the previous year, and the amount of<br />
insurance-in-force at the end of the fiscal year<br />
increased compared with the end of the previous<br />
year. Operating income at <strong>Sony</strong> Life in-<br />
0<br />
creased due to improvements in valuation gains<br />
and losses from investments in the general account.<br />
The above mentioned change in revenue<br />
recognition method did not have a material effect<br />
on operating income. Valuation gains and<br />
losses from investments in the separate account<br />
accrue directly to the account of policyholders<br />
and, therefore, do not affect operating income.<br />
At <strong>Sony</strong> Assurance Inc. (“<strong>Sony</strong> Assurance”),<br />
revenue increased due to higher insurance<br />
revenue brought about by an expansion in<br />
automobile insurance-in-force. Operating<br />
income was recorded during the fiscal year<br />
compared to an operating loss in the previous<br />
fiscal year due to the increase in insurance<br />
revenue and an improvement in the expense<br />
ratio (the ratio of operating expenses to<br />
premiums) and the loss ratio (the ratio of<br />
insurance payouts to premiums).<br />
At <strong>Sony</strong> Finance International, Inc. (“<strong>Sony</strong><br />
Finance”), a leasing and credit financing<br />
business subsidiary in Japan, revenue was<br />
unchanged compared to the previous year as<br />
credit financing revenue increased slightly<br />
and leasing revenue and rent revenue decreased<br />
slightly. In terms of profitability, operating<br />
loss increased due to the recording of a<br />
loss from the lease of certain fixed assets to<br />
Crosswave Communications Inc., which<br />
commenced reorganization proceedings under<br />
the Corporate Reorganization Law of Japan,<br />
and an increase in expenses associated with<br />
the start, in earnest, of a credit card business.<br />
<strong>Sony</strong> Bank Inc. (“<strong>Sony</strong> Bank”), which<br />
started business in June 2001, recorded a loss,<br />
as was also the case in the previous fiscal year,<br />
but the amount of loss decreased.<br />
* The revenue and operating income at <strong>Sony</strong> Life, <strong>Sony</strong> Assurance<br />
and <strong>Sony</strong> Bank discussed here differ from the results that <strong>Sony</strong><br />
Life, <strong>Sony</strong> Assurance and <strong>Sony</strong> Bank disclose on a Japanese<br />
statutory basis.<br />
CONDENSED STATEMENTS OF INCOME<br />
SEPARATING OUT THE FINANCIAL SERVICES<br />
SEGMENT (UNAUDITED)<br />
The following schedule shows unaudited<br />
condensed statements of income for the<br />
Financial Services segment and all other<br />
segments excluding Financial Services as well<br />
as condensed consolidated statements of<br />
income. This presentation is not required<br />
under U.S. GAAP, which is used in <strong>Sony</strong>’s<br />
consolidated financial statements. However,<br />
because the Financial Services segment is different<br />
in nature from <strong>Sony</strong>’s other segments,<br />
<strong>Sony</strong> believes that a comparative presentation<br />
may be useful in understanding and analyzing<br />
<strong>Sony</strong>’s consolidated financial statements.<br />
Transactions between the Financial Services<br />
segment and all other segments excluding<br />
Financial Services are eliminated in the consolidated<br />
figures shown below.<br />
CONDENSED STATEMENTS OF INCOME SEPARATING OUT THE FINANCIAL SERVICES SEGMENT<br />
Year ended March 31<br />
All other segments<br />
Financial Services excluding Financial Services Consolidated<br />
(Yen in millions) 2003 2004 2003 2004 2003 2004<br />
Financial Services revenue . . . . . . . . . . . . . . . . . . . . . . . . . . . . . 537,276 593,544 – – 509,398 565,752<br />
Net sales and operating revenue . . . . . . . . . . . . . . . . . . . . . . . . – – 6,974,980 6,939,964 6,964,235 6,930,639<br />
537,276 593,544 6,974,980 6,939,964 7,473,633 7,496,391<br />
Costs and expenses . . . . . . . . . . . . . . . . . . . . . . . . . . . . . . . . . 514,518 538,383 6,811,292 6,896,377 7,288,193 7,397,489<br />
Operating income . . . . . . . . . . . . . . . . . . . . . . . . . . . . . . . . . . 22,758 55,161 163,688 43,587 185,440 98,902<br />
Other income (expenses), net . . . . . . . . . . . . . . . . . . . . . . . . . . (1,282) 1,958 67,846 52,746 62,181 45,165<br />
Income before income taxes . . . . . . . . . . . . . . . . . . . . . . . . . . . 21,476 57,119 231,534 96,333 247,621 144,067<br />
Income taxes and other . . . . . . . . . . . . . . . . . . . . . . . . . . . . . . 13,071 22,975 120,089 30,916 132,102 53,439<br />
Cumulative effect of accounting changes . . . . . . . . . . . . . . . . . – – – (2,117) – (2,117)<br />
Net income . . . . . . . . . . . . . . . . . . . . . . . . . . . . . . . . . . . . . . . 8,405 34,144 111,445 63,300 115,519 88,511<br />
69