![PDF [4833KB] - Sony](https://img.yumpu.com/26420643/107/500x640/pdf-4833kb-sony.jpg)
PDF [4833KB] - Sony
PDF [4833KB] - Sony
PDF [4833KB] - Sony

You also want an ePaper? Increase the reach of your titles
YUMPU automatically turns print PDFs into web optimized ePapers that Google loves.
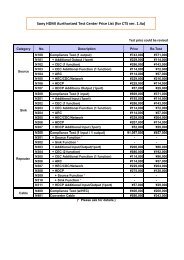
Stock Information<br />
Ownership and Distribution of Shares (Year ended March 31)<br />
2002 2003 2004<br />
Number of Number of Number of Number of Number of Number of<br />
Shares Held Shareholders Shares Held Shareholders Shares Held Shareholders<br />
Foreign Institutions and Individuals 356,673,842 1,667 331,477,756 1,660 366,289,954 1,444<br />
Japanese Financial Institutions 260,533,688 485 249,934,658 446 192,651,120 386<br />
Japanese Individuals and Others 253,033,597 717,141 281,939,398 791,371 316,428,972 823,335<br />
Other Japanese Corporations 47,924,895 5,755 51,973,659 6,017 44,113,525 5,726<br />
Japanese Securities Firms 4,650,333 76 10,131,705 121 10,006,709 97<br />
Total 922,816,355 725,124 925,457,176 799,615 929,490,280 830,988<br />
Foreign Institutions and Individuals<br />
Japanese Financial Institutions<br />
Japanese Individuals<br />
and Others<br />
Other Japanese<br />
Corporations<br />
Japanese<br />
Securities Firms<br />
2002<br />
38.7%<br />
28.2%<br />
27.4%<br />
5.2%<br />
0.5%<br />
2003<br />
35.8%<br />
27.0%<br />
30.5%<br />
5.6%<br />
1.1%<br />
2004<br />
39.4%<br />
20.7%<br />
34.0%<br />
4.8%<br />
1.1%<br />
Stock Price Range and Trading Volume on the Tokyo Stock Exchange<br />
Nikkei Stock Average Closing Price of <strong>Sony</strong> Corporation Stock Subsidiary Tracking Stock<br />
Stock Price and<br />
Nikkei Stock Average<br />
(¥)<br />
25,000<br />
20,000<br />
15,000<br />
10,000<br />
Trading Volume<br />
(million shares)<br />
200<br />
5,000<br />
0<br />
100<br />
0<br />
2000 2001 2002 2003 2004<br />
Notes: 1. This trading volume shows the monthly volume of trade on the Tokyo Stock Exchange. Each fiscal year starts in April and ends in March.<br />
2. Stock prices and the Nikkei Stock Average is based on a simple average of daily closing prices for each day of every month at the Tokyo Stock Exchange.<br />
3. Stock prices have been adjusted to reflect the two-for-one stock split completed on May 19, 2000.<br />
4. On June 20, 2001, <strong>Sony</strong> issued 3,072,000 shares of Subsidiary Tracking Stock.<br />
(Year ended March 31)<br />
(Year ended March 31)<br />
2000 2001 2002 2003 2004<br />
Stock Price (¥)<br />
At year-end 14,500 8,900 6,700 4,200 4,360<br />
High 16,950 15,100 10,340 7,530 4,670<br />
Low 5,360 7,510 3,960 4,070 2,720<br />
Annual Increase/Decrease +164.8% –38.6% –24.7% –37.3% +3.8%<br />
Number of Shares Outstanding at Year-end<br />
(thousands of shares) 453,639 919,617 919,744 922,385 926,418<br />
Market Capitalization at Year-end (trillion ¥) 13.16 8.16 6.16 3.87 4.04<br />
Per Share of Common Stock Data (¥)<br />
Cash Dividends Applicable to the Year 25.0 25.0 25.0 25.0 25.0<br />
Net Income (Diluted) 131.70 19.28 16.67 118.21 90.88<br />
Stockholders’ Equity 2,409.36 2,521.19 2,570.31 2,466.81 2,563.67<br />
Note: Stock Prices and Per Share Data have been adjusted to reflect the two-for-one stock split completed on May 19, 2000. However, no adjustment to reflect such stock split has been made to the<br />
Number of Shares Outstanding at the year ended March 31, 2000. Stock price data are based on daily closing prices.<br />
105