biologia - Studia
biologia - Studia
biologia - Studia

You also want an ePaper? Increase the reach of your titles
YUMPU automatically turns print PDFs into web optimized ePapers that Google loves.
CHARACTERIZATION OF ALPHA-AMYLASE FROM BACILLUS SUBTILIS STRAIN<br />
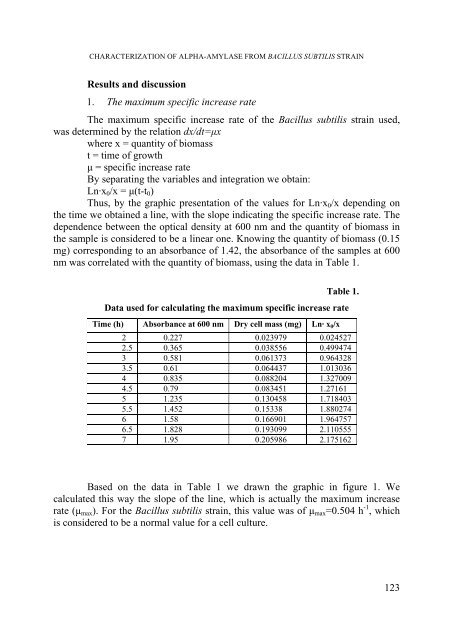
Results and discussion<br />
1. The maximum specific increase rate<br />
The maximum specific increase rate of the Bacillus subtilis strain used,<br />
was determined by the relation dx/dt=µx<br />
where x = quantity of biomass<br />
t = time of growth<br />
µ = specific increase rate<br />
By separating the variables and integration we obtain:<br />
Ln·x 0 /x = µ(t-t 0 )<br />
Thus, by the graphic presentation of the values for Ln·x 0 /x depending on<br />
the time we obtained a line, with the slope indicating the specific increase rate. The<br />
dependence between the optical density at 600 nm and the quantity of biomass in<br />
the sample is considered to be a linear one. Knowing the quantity of biomass (0.15<br />
mg) corresponding to an absorbance of 1.42, the absorbance of the samples at 600<br />
nm was correlated with the quantity of biomass, using the data in Table 1.<br />
Table 1.<br />
Data used for calculating the maximum specific increase rate<br />
Time (h) Absorbance at 600 nm Dry cell mass (mg) Ln· x 0 /x<br />
2 0.227 0.023979 0.024527<br />
2.5 0.365 0.038556 0.499474<br />
3 0.581 0.061373 0.964328<br />
3.5 0.61 0.064437 1.013036<br />
4 0.835 0.088204 1.327009<br />
4.5 0.79 0.083451 1.27161<br />
5 1.235 0.130458 1.718403<br />
5.5 1.452 0.15338 1.880274<br />
6 1.58 0.166901 1.964757<br />
6.5 1.828 0.193099 2.110555<br />
7 1.95 0.205986 2.175162<br />
Based on the data in Table 1 we drawn the graphic in figure 1. We<br />
calculated this way the slope of the line, which is actually the maximum increase<br />
rate (µ max ). For the Bacillus subtilis strain, this value was of µ max =0.504 h -1 , which<br />
is considered to be a normal value for a cell culture.<br />
123