biologia - Studia
biologia - Studia
biologia - Studia

Create successful ePaper yourself
Turn your PDF publications into a flip-book with our unique Google optimized e-Paper software.
Atm PROTEIN CAN SWITCH OFF THE DNA DAMAGE SIGNAL IN A p53 MODEL<br />
however, the parameters α<br />
is<br />
, i = 1,2 , which control phosphorylation and<br />
dephosphorylation rate of the Atm protein, are more biologically important.<br />
Meanwhile, because the total amount of the Atm protein and its phosphorylated<br />
form, Atm-p, is assumed to be constantly µ , so we can consider Λ Λ(<br />
k , k )<br />
=<br />
1s<br />
2s<br />
and solve the equation Λ = 0 with respect to k 2 s<br />
and find k<br />
2s<br />
= µ ( µ + k1s<br />
)/ k1s.<br />
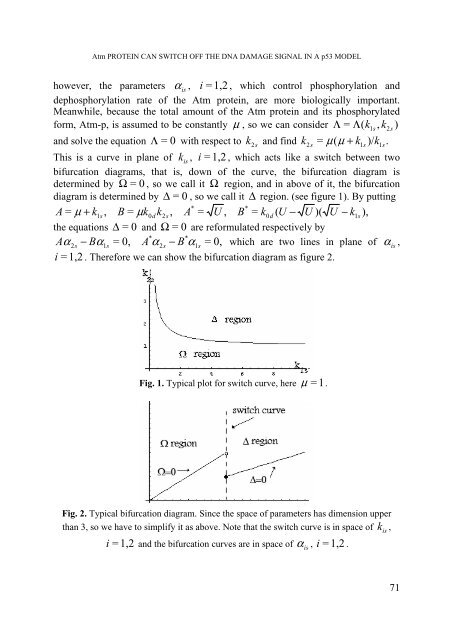
This is a curve in plane of k<br />
is<br />
, i = 1,2 , which acts like a switch between two<br />
bifurcation diagrams, that is, down of the curve, the bifurcation diagram is<br />
determined by Ω = 0 , so we call it Ω region, and in above of it, the bifurcation<br />
diagram is determined by ∆ = 0 , so we call it ∆ region. (see figure 1). By putting<br />
*<br />
*<br />
A = µ + k1s<br />
, B = µ k0dk2s,<br />
A = U , B = k0d<br />
( U − U )( U − k1s<br />
),<br />
the equations ∆ = 0 and Ω = 0 are reformulated respectively by<br />
* *<br />
Aα<br />
2s<br />
− Bα1s<br />
= 0, A α<br />
2s<br />
− B α1s<br />
= 0, which are two lines in plane of α<br />
is<br />
,<br />
i = 1,2 . Therefore we can show the bifurcation diagram as figure 2.<br />
Fig. 1. Typical plot for switch curve, here µ = 1.<br />
Fig. 2. Typical bifurcation diagram. Since the space of parameters has dimension upper<br />
than 3, so we have to simplify it as above. Note that the switch curve is in space of k<br />
is<br />
,<br />
α , i = 1,2 .<br />
i = 1,2 and the bifurcation curves are in space of<br />
is<br />
71