biologia - Studia
biologia - Studia
biologia - Studia

You also want an ePaper? Increase the reach of your titles
YUMPU automatically turns print PDFs into web optimized ePapers that Google loves.
MODIFICATIONS OF BONE PARAMETERS IN OSTEOPOROSIS<br />
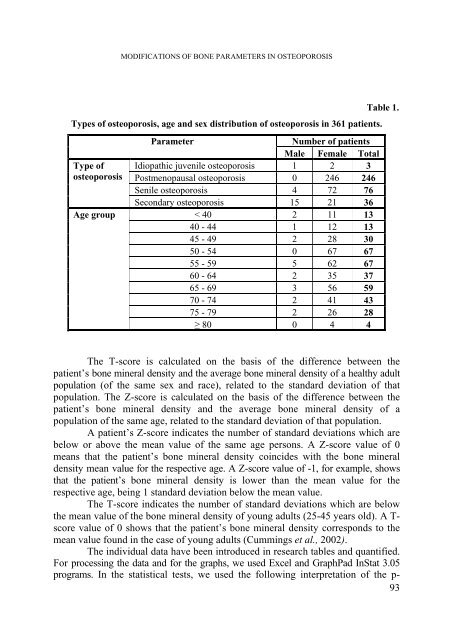
Types of osteoporosis, age and sex distribution of osteoporosis in 361 patients.<br />
Type of<br />
osteoporosis<br />
Age group<br />
Parameter<br />
Number of patients<br />
Male Female Total<br />
Idiopathic juvenile osteoporosis 1 2 3<br />
Postmenopausal osteoporosis 0 246 246<br />
Senile osteoporosis 4 72 76<br />
Secondary osteoporosis 15 21 36<br />
< 40 2 11 13<br />
40 - 44 1 12 13<br />
45 - 49 2 28 30<br />
50 - 54 0 67 67<br />
55 - 59 5 62 67<br />
60 - 64 2 35 37<br />
65 - 69 3 56 59<br />
70 - 74 2 41 43<br />
75 - 79 2 26 28<br />
≥ 80 0 4 4<br />
Table 1.<br />
The T-score is calculated on the basis of the difference between the<br />
patient’s bone mineral density and the average bone mineral density of a healthy adult<br />
population (of the same sex and race), related to the standard deviation of that<br />
population. The Z-score is calculated on the basis of the difference between the<br />
patient’s bone mineral density and the average bone mineral density of a<br />
population of the same age, related to the standard deviation of that population.<br />
A patient’s Z-score indicates the number of standard deviations which are<br />
below or above the mean value of the same age persons. A Z-score value of 0<br />
means that the patient’s bone mineral density coincides with the bone mineral<br />
density mean value for the respective age. A Z-score value of -1, for example, shows<br />
that the patient’s bone mineral density is lower than the mean value for the<br />
respective age, being 1 standard deviation below the mean value.<br />
The T-score indicates the number of standard deviations which are below<br />
the mean value of the bone mineral density of young adults (25-45 years old). A T-<br />
score value of 0 shows that the patient’s bone mineral density corresponds to the<br />
mean value found in the case of young adults (Cummings et al., 2002).<br />
The individual data have been introduced in research tables and quantified.<br />
For processing the data and for the graphs, we used Excel and GraphPad InStat 3.05<br />
programs. In the statistical tests, we used the following interpretation of the p-<br />
93