Gender Equality Scheme - Swansea University
Gender Equality Scheme - Swansea University
Gender Equality Scheme - Swansea University

Create successful ePaper yourself
Turn your PDF publications into a flip-book with our unique Google optimized e-Paper software.
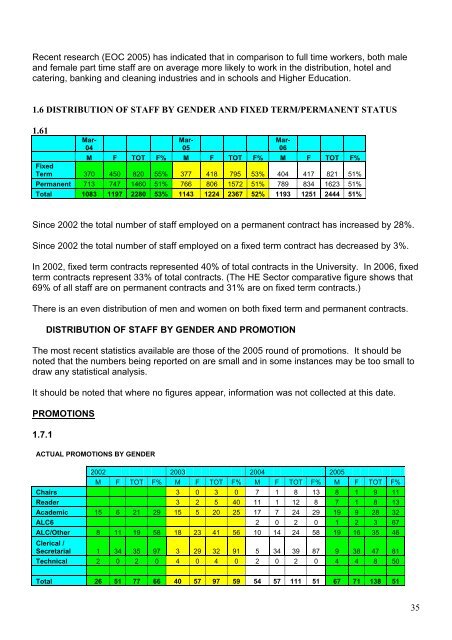
Recent research (EOC 2005) has indicated that in comparison to full time workers, both male<br />
and female part time staff are on average more likely to work in the distribution, hotel and<br />
catering, banking and cleaning industries and in schools and Higher Education.<br />
1.6 DISTRIBUTION OF STAFF BY GENDER AND FIXED TERM/PERMANENT STATUS<br />
1.61<br />
Mar-<br />
04<br />
Mar-<br />
05<br />
M F TOT F% M F TOT F% M F TOT F%<br />
Fixed<br />
Term 370 450 820 55% 377 418 795 53% 404 417 821 51%<br />
Permanent 713 747 1460 51% 766 806 1572 51% 789 834 1623 51%<br />
Total 1083 1197 2280 53% 1143 1224 2367 52% 1193 1251 2444 51%<br />
Mar-<br />
06<br />
Since 2002 the total number of staff employed on a permanent contract has increased by 28%.<br />
Since 2002 the total number of staff employed on a fixed term contract has decreased by 3%.<br />
In 2002, fixed term contracts represented 40% of t otal contracts in the <strong>University</strong>. In 2006, fixed<br />
term contracts represent 33% of tota l contrac ts. (The H E Sector comparative figure shows that<br />
69 % of all staff are on permanent contracts and 31% are on fixed term contracts.)<br />
T here is an even distributio n of m en and women on both fixed t erm and permanent contracts.<br />
DISTRIBUTION O F STAF F BY<br />
GENDER AND PROMOTION<br />
The most recent statistics available are those of the 2005 round of promotions. It should be<br />
noted that the numbers being reported on are small and in some instances may be too small to<br />
draw any statistical analysis.<br />
It should be noted that whe re no figure s appear, informa tion was not collected<br />
at this date.<br />
PROMOTIONS<br />
1.7.1<br />
ACTUAL PROMOT IONS BY GENDER<br />
2002 2003 2004 2005<br />
M F TOT F% M F TOT F% M F TOT F% M F TOT F%<br />
Chairs 3 0 3 0 7 1 8 13 8 1 9 11<br />
Reader 3 2 5 40 11 1 12 8 7 1 8 13<br />
Academic 15 6 21 29 15 5 20 25 17 7 24 29 19 9 28 32<br />
ALC6 2 0 2 0 1 2 3 67<br />
ALC/Other 8 11 19 58 18 23 41 56 10 14 24 58 19 16 35 46<br />
Clerical /<br />
Secretarial 1 34 35 97 3 29 32 91 5 34 39 87 9 38 47 81<br />
Technical 2 0 2 0 4 0 4 0 2 0 2 0 4 4 8 50<br />
Total 26 51 77 66 40 57 97 59 54 57 111 51 67 71 138 51<br />
35