Samriddhi
Samriddhi
Samriddhi
Create successful ePaper yourself
Turn your PDF publications into a flip-book with our unique Google optimized e-Paper software.
<strong>Samriddhi</strong> Project Document Phase 1<br />
Annexes<br />
b. Feasibility of changes induced by project interventions<br />
c. Quantification of offers to value chain actors (preliminary budget)<br />
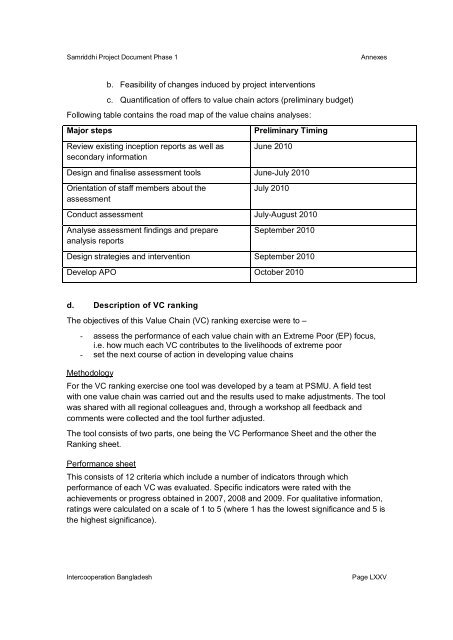
Following table contains the road map of the value chains analyses:<br />
Major steps<br />
Preliminary Timing<br />
Review existing inception reports as well as<br />
secondary information<br />
June 2010<br />
Design and finalise assessment tools June-July 2010<br />
Orientation of staff members about the<br />
assessment<br />
July 2010<br />
Conduct assessment July-August 2010<br />
Analyse assessment findings and prepare<br />
analysis reports<br />
September 2010<br />
Design strategies and intervention September 2010<br />
Develop APO October 2010<br />
d. Description of VC ranking<br />
The objectives of this Value Chain (VC) ranking exercise were to –<br />
- assess the performance of each value chain with an Extreme Poor (EP) focus,<br />
i.e. how much each VC contributes to the livelihoods of extreme poor<br />
- set the next course of action in developing value chains<br />
Methodology<br />
For the VC ranking exercise one tool was developed by a team at PSMU. A field test<br />
with one value chain was carried out and the results used to make adjustments. The tool<br />
was shared with all regional colleagues and, through a workshop all feedback and<br />
comments were collected and the tool further adjusted.<br />
The tool consists of two parts, one being the VC Performance Sheet and the other the<br />
Ranking sheet.<br />
Performance sheet<br />
This consists of 12 criteria which include a number of indicators through which<br />
performance of each VC was evaluated. Specific indicators were rated with the<br />
achievements or progress obtained in 2007, 2008 and 2009. For qualitative information,<br />
ratings were calculated on a scale of 1 to 5 (where 1 has the lowest significance and 5 is<br />
the highest significance).<br />
Intercooperation Bangladesh<br />
Page LXXV


