Impact of fuel supply impedance and fuel staging on gas turbine ...
Impact of fuel supply impedance and fuel staging on gas turbine ...
Impact of fuel supply impedance and fuel staging on gas turbine ...

Create successful ePaper yourself
Turn your PDF publications into a flip-book with our unique Google optimized e-Paper software.
7.2 Acoustic network model results<br />
fluctuati<strong>on</strong>s can lead to lower thermo-acoustic oscillati<strong>on</strong>s in combusti<strong>on</strong><br />
systems. However, the models derived <strong>on</strong>ly account for the impact <str<strong>on</strong>g>of</str<strong>on</strong>g> equivalence<br />
fluctuati<strong>on</strong>s <strong>on</strong> the heat release rate. As the heat release rate fluctuati<strong>on</strong><br />
in a practical premixed system is also driven by the kinematic resp<strong>on</strong>se <str<strong>on</strong>g>of</str<strong>on</strong>g> the<br />
flame, tuning <str<strong>on</strong>g>of</str<strong>on</strong>g> the amplitude <str<strong>on</strong>g>and</str<strong>on</strong>g> phase <str<strong>on</strong>g>of</str<strong>on</strong>g> equivalence ratio fluctuati<strong>on</strong>s<br />
al<strong>on</strong>e will in general not be sufficient to achieve a stable system. In the worst<br />
case it may lead also to a more unstable system, which is explained in the<br />
following.<br />
Taking into account both c<strong>on</strong>tributi<strong>on</strong>s (F u u ′ b /ū b, F φ,i φ ′ i / ¯φ) to fluctuati<strong>on</strong>s<br />
<str<strong>on</strong>g>of</str<strong>on</strong>g> heat release rate, a reducti<strong>on</strong> <str<strong>on</strong>g>of</str<strong>on</strong>g> the heat release rate fluctuati<strong>on</strong> can also<br />
be achieved if the phase difference between both equals π. This implies that<br />
both c<strong>on</strong>tributi<strong>on</strong>s are out <str<strong>on</strong>g>of</str<strong>on</strong>g> phase with respect to each other <str<strong>on</strong>g>and</str<strong>on</strong>g> lead to a<br />
destructive interference:<br />
F u (ω) u′ b (ω)<br />
ū b<br />
+ F φ,i (ω) φ′ i (ω)<br />
¯φ<br />
→ 0. (7.5)<br />
The superpositi<strong>on</strong> <str<strong>on</strong>g>of</str<strong>on</strong>g> both c<strong>on</strong>tributi<strong>on</strong>s equals zero if the corresp<strong>on</strong>ding amplitudes<br />
have the same order <str<strong>on</strong>g>of</str<strong>on</strong>g> magnitude. Returning to the argument above,<br />
such a c<strong>on</strong>stellati<strong>on</strong> would be affected in a negative way if the amplitude <str<strong>on</strong>g>of</str<strong>on</strong>g><br />
the equivalence ratio fluctuati<strong>on</strong>s is reduced. The result would be an undesired<br />
increase <str<strong>on</strong>g>of</str<strong>on</strong>g> the heat release rate fluctuati<strong>on</strong>s.<br />
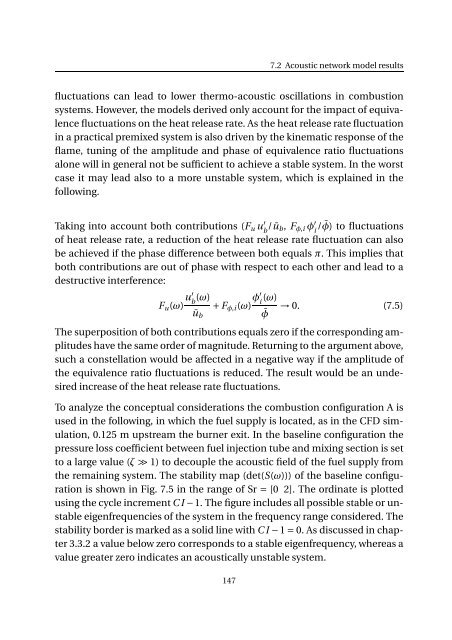
To analyze the c<strong>on</strong>ceptual c<strong>on</strong>siderati<strong>on</strong>s the combusti<strong>on</strong> c<strong>on</strong>figurati<strong>on</strong> A is<br />
used in the following, in which the <str<strong>on</strong>g>fuel</str<strong>on</strong>g> <str<strong>on</strong>g>supply</str<strong>on</strong>g> is located, as in the CFD simulati<strong>on</strong>,<br />
0.125 m upstream the burner exit. In the baseline c<strong>on</strong>figurati<strong>on</strong> the<br />
pressure loss coefficient between <str<strong>on</strong>g>fuel</str<strong>on</strong>g> injecti<strong>on</strong> tube <str<strong>on</strong>g>and</str<strong>on</strong>g> mixing secti<strong>on</strong> is set<br />
to a large value (ζ≫1) to decouple the acoustic field <str<strong>on</strong>g>of</str<strong>on</strong>g> the <str<strong>on</strong>g>fuel</str<strong>on</strong>g> <str<strong>on</strong>g>supply</str<strong>on</strong>g> from<br />
the remaining system. The stability map (det(S(ω))) <str<strong>on</strong>g>of</str<strong>on</strong>g> the baseline c<strong>on</strong>figurati<strong>on</strong><br />
is shown in Fig. 7.5 in the range <str<strong>on</strong>g>of</str<strong>on</strong>g> Sr = [0 2]. The ordinate is plotted<br />
using the cycle increment C I−1. The figure includes all possible stable or unstable<br />
eigenfrequencies <str<strong>on</strong>g>of</str<strong>on</strong>g> the system in the frequency range c<strong>on</strong>sidered. The<br />
stability border is marked as a solid line with C I− 1=0. As discussed in chapter<br />
3.3.2 a value below zero corresp<strong>on</strong>ds to a stable eigenfrequency, whereas a<br />
value greater zero indicates an acoustically unstable system.<br />
147