Impact of fuel supply impedance and fuel staging on gas turbine ...
Impact of fuel supply impedance and fuel staging on gas turbine ...
Impact of fuel supply impedance and fuel staging on gas turbine ...

Create successful ePaper yourself
Turn your PDF publications into a flip-book with our unique Google optimized e-Paper software.
3.3 Acoustic network model<br />
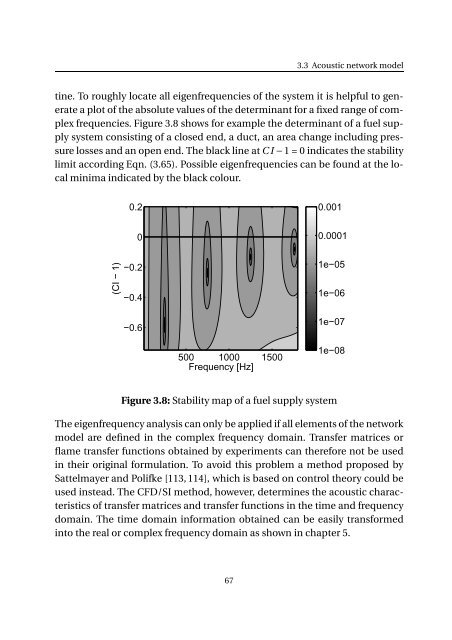
tine. To roughly locate all eigenfrequencies <str<strong>on</strong>g>of</str<strong>on</strong>g> the system it is helpful to generate<br />
a plot <str<strong>on</strong>g>of</str<strong>on</strong>g> the absolute values <str<strong>on</strong>g>of</str<strong>on</strong>g> the determinant for a fixed range <str<strong>on</strong>g>of</str<strong>on</strong>g> complex<br />
frequencies. Figure 3.8 shows for example the determinant <str<strong>on</strong>g>of</str<strong>on</strong>g> a <str<strong>on</strong>g>fuel</str<strong>on</strong>g> <str<strong>on</strong>g>supply</str<strong>on</strong>g><br />
system c<strong>on</strong>sisting <str<strong>on</strong>g>of</str<strong>on</strong>g> a closed end, a duct, an area change including pressure<br />
losses <str<strong>on</strong>g>and</str<strong>on</strong>g> an open end. The black line at C I−1 = 0 indicates the stability<br />
limit according Eqn. (3.65). Possible eigenfrequencies can be found at the local<br />
minima indicated by the black colour.<br />
0.2<br />
0.001<br />
0<br />
0.0001<br />
(CI − 1)<br />
−0.2<br />
−0.4<br />
1e−05<br />
1e−06<br />
−0.6<br />
1e−07<br />
500 1000 1500<br />
Frequency [Hz]<br />
1e−08<br />
Figure 3.8: Stability map <str<strong>on</strong>g>of</str<strong>on</strong>g> a <str<strong>on</strong>g>fuel</str<strong>on</strong>g> <str<strong>on</strong>g>supply</str<strong>on</strong>g> system<br />
The eigenfrequency analysis can <strong>on</strong>ly be applied if all elements <str<strong>on</strong>g>of</str<strong>on</strong>g> the network<br />
model are defined in the complex frequency domain. Transfer matrices or<br />
flame transfer functi<strong>on</strong>s obtained by experiments can therefore not be used<br />
in their original formulati<strong>on</strong>. To avoid this problem a method proposed by<br />
Sattelmayer <str<strong>on</strong>g>and</str<strong>on</strong>g> Polifke [113, 114], which is based <strong>on</strong> c<strong>on</strong>trol theory could be<br />
used instead. The CFD/SI method, however, determines the acoustic characteristics<br />
<str<strong>on</strong>g>of</str<strong>on</strong>g> transfer matrices <str<strong>on</strong>g>and</str<strong>on</strong>g> transfer functi<strong>on</strong>s in the time <str<strong>on</strong>g>and</str<strong>on</strong>g> frequency<br />
domain. The time domain informati<strong>on</strong> obtained can be easily transformed<br />
into the real or complex frequency domain as shown in chapter 5.<br />
67