Hydraulic Efficiency of Grate and Curb Inlets - Urban Drainage and ...
Hydraulic Efficiency of Grate and Curb Inlets - Urban Drainage and ...
Hydraulic Efficiency of Grate and Curb Inlets - Urban Drainage and ...

You also want an ePaper? Increase the reach of your titles
YUMPU automatically turns print PDFs into web optimized ePapers that Google loves.
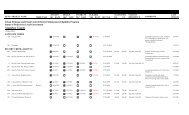
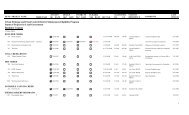
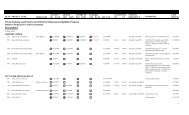
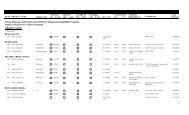
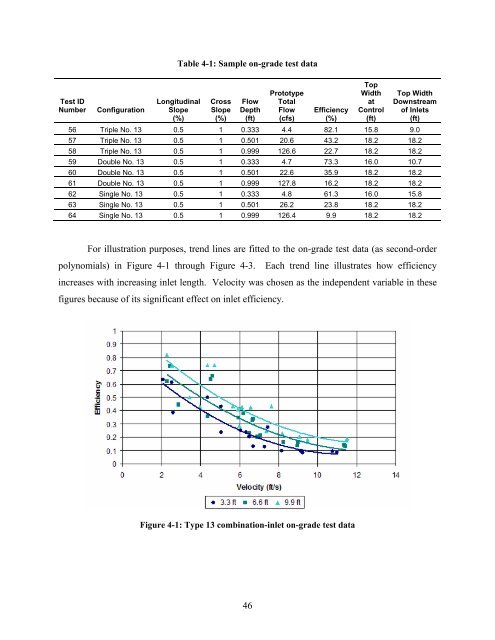
Table 4-1: Sample on-grade test data<br />
Test ID<br />
Number<br />
Configuration<br />
Longitudinal<br />
Slope<br />
(%)<br />
Cross<br />
Slope<br />
(%)<br />
Flow<br />
Depth<br />
(ft)<br />
Prototype<br />
Total<br />
Flow<br />
(cfs)<br />
<strong>Efficiency</strong><br />
(%)<br />
Top<br />
Width<br />
at<br />
Control<br />
(ft)<br />
Top Width<br />
Downstream<br />
<strong>of</strong> <strong>Inlets</strong><br />
(ft)<br />
56 Triple No. 13 0.5 1 0.333 4.4 82.1 15.8 9.0<br />
57 Triple No. 13 0.5 1 0.501 20.6 43.2 18.2 18.2<br />
58 Triple No. 13 0.5 1 0.999 126.6 22.7 18.2 18.2<br />
59 Double No. 13 0.5 1 0.333 4.7 73.3 16.0 10.7<br />
60 Double No. 13 0.5 1 0.501 22.6 35.9 18.2 18.2<br />
61 Double No. 13 0.5 1 0.999 127.8 16.2 18.2 18.2<br />
62 Single No. 13 0.5 1 0.333 4.8 61.3 16.0 15.8<br />
63 Single No. 13 0.5 1 0.501 26.2 23.8 18.2 18.2<br />
64 Single No. 13 0.5 1 0.999 126.4 9.9 18.2 18.2<br />
For illustration purposes, trend lines are fitted to the on-grade test data (as second-order<br />
polynomials) in Figure 4-1 through Figure 4-3. Each trend line illustrates how efficiency<br />
increases with increasing inlet length. Velocity was chosen as the independent variable in these<br />
figures because <strong>of</strong> its significant effect on inlet efficiency.<br />
Figure 4-1: Type 13 combination-inlet on-grade test data<br />
46