Hydraulic Efficiency of Grate and Curb Inlets - Urban Drainage and ...
Hydraulic Efficiency of Grate and Curb Inlets - Urban Drainage and ...
Hydraulic Efficiency of Grate and Curb Inlets - Urban Drainage and ...
You also want an ePaper? Increase the reach of your titles
YUMPU automatically turns print PDFs into web optimized ePapers that Google loves.
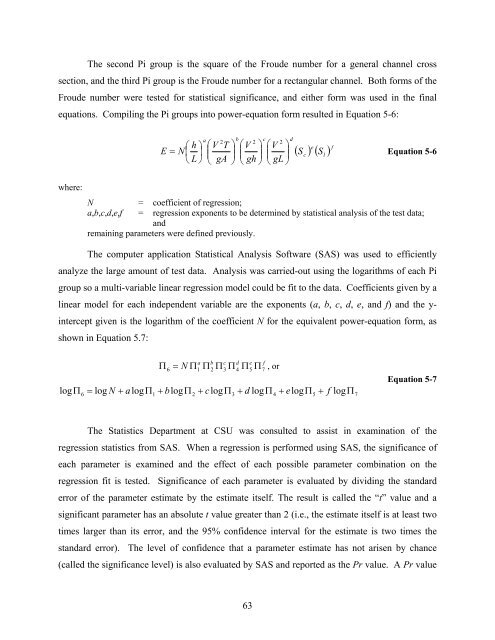
The second Pi group is the square <strong>of</strong> the Froude number for a general channel cross<br />
section, <strong>and</strong> the third Pi group is the Froude number for a rectangular channel. Both forms <strong>of</strong> the<br />
Froude number were tested for statistical significance, <strong>and</strong> either form was used in the final<br />
equations. Compiling the Pi groups into power-equation form resulted in Equation 5-6:<br />
⎛<br />
E = N⎜<br />
⎝<br />
h<br />
L<br />
a<br />
b<br />
2<br />
⎞ ⎛V<br />
T ⎞<br />
⎟<br />
⎜<br />
gA<br />
⎟<br />
⎠ ⎝ ⎠<br />
2<br />
⎛V<br />
⎞<br />
⎜<br />
gh<br />
⎟<br />
⎝ ⎠<br />
c<br />
2<br />
⎛V<br />
gL ⎟ ⎞<br />
⎜<br />
⎝ ⎠<br />
d<br />
e<br />
( S ) ( S ) f<br />
c<br />
l<br />
Equation 5-6<br />
where:<br />
N = coefficient <strong>of</strong> regression;<br />
a,b,c,d,e,f = regression exponents to be determined by statistical analysis <strong>of</strong> the test data;<br />
<strong>and</strong><br />
remaining parameters were defined previously.<br />
The computer application Statistical Analysis S<strong>of</strong>tware (SAS) was used to efficiently<br />
analyze the large amount <strong>of</strong> test data. Analysis was carried-out using the logarithms <strong>of</strong> each Pi<br />
group so a multi-variable linear regression model could be fit to the data. Coefficients given by a<br />
linear model for each independent variable are the exponents (a, b, c, d, e, <strong>and</strong> f) <strong>and</strong> the y-<br />
intercept given is the logarithm <strong>of</strong> the coefficient N for the equivalent power-equation form, as<br />
shown in Equation 5.7:<br />
logΠ<br />
Π<br />
a b c d e f<br />
6<br />
= N Π1<br />
Π2<br />
Π3<br />
Π<br />
4<br />
Π5<br />
Π7<br />
6<br />
= log N + alogΠ1<br />
+ blogΠ2<br />
+ clogΠ3<br />
+ d logΠ4<br />
+ elogΠ5<br />
+ f log<br />
, or<br />
Π<br />
7<br />
Equation 5-7<br />
The Statistics Department at CSU was consulted to assist in examination <strong>of</strong> the<br />
regression statistics from SAS. When a regression is performed using SAS, the significance <strong>of</strong><br />
each parameter is examined <strong>and</strong> the effect <strong>of</strong> each possible parameter combination on the<br />
regression fit is tested. Significance <strong>of</strong> each parameter is evaluated by dividing the st<strong>and</strong>ard<br />
error <strong>of</strong> the parameter estimate by the estimate itself. The result is called the “t” value <strong>and</strong> a<br />
significant parameter has an absolute t value greater than 2 (i.e., the estimate itself is at least two<br />
times larger than its error, <strong>and</strong> the 95% confidence interval for the estimate is two times the<br />
st<strong>and</strong>ard error). The level <strong>of</strong> confidence that a parameter estimate has not arisen by chance<br />
(called the significance level) is also evaluated by SAS <strong>and</strong> reported as the Pr value. A Pr value<br />
63


