Hydraulic Efficiency of Grate and Curb Inlets - Urban Drainage and ...
Hydraulic Efficiency of Grate and Curb Inlets - Urban Drainage and ...
Hydraulic Efficiency of Grate and Curb Inlets - Urban Drainage and ...

Create successful ePaper yourself
Turn your PDF publications into a flip-book with our unique Google optimized e-Paper software.
• The inlet efficiency appears to asymptotically approach a minimum value as the<br />
velocity increases.<br />
• As the inlet length increases for a given flow velocity, the efficiency increases.<br />
• The spread <strong>of</strong> water across the street section for a given flow decreases as either <strong>of</strong><br />
the slopes increase.<br />
• For a given longitudinal slope, a lower cross slope shows a slightly faster rate <strong>of</strong><br />
decrease in efficiency as the velocity increases.<br />
• For a given cross slope, a lower longitudinal slope shows a slightly faster rate <strong>of</strong><br />
decrease in efficiency as the velocity increases.<br />
• For a given inlet length, the Type 16 inlet is generally the most efficient, followed by<br />
the Type 13 <strong>and</strong> Type R.<br />
4.2 Sump Tests<br />
A tabular sample <strong>of</strong> the sump test data is presented as Table 4-2. All <strong>of</strong> the flow into the<br />
model was captured by the inlets in the sump test condition. The entire sump test data set is<br />
included as Appendix C.<br />
Test ID<br />
Number<br />
Configuration<br />
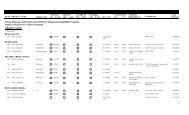
Table 4-2: Sample sump test data<br />
Longitudinal<br />
Slope<br />
(%)<br />
Cross<br />
Slope<br />
(%)<br />
Flow<br />
Depth<br />
(ft)<br />
Prototype<br />
Flow<br />
(cfs)<br />
1 Triple No. 13 0 1 0.333 2.5<br />
2 Triple No. 13 0 1 0.501 8.6<br />
3 Triple No. 13 0 1 0.999 42.2<br />
4 Double No. 13 0 1 0.333 2.3<br />
5 Double No. 13 0 1 0.501 7.8<br />
6 Double No. 13 0 1 0.999 27.1<br />
7 Single No. 13 0 1 0.333 2.0<br />
8 Single No. 13 0 1 0.501 5.9<br />
9 Single No. 13 0 1 0.999 15.3<br />
The sump test data are plotted in Figure 4-4 through Figure 4-6 for increasing flow depth<br />
for the three inlets tested.<br />
48