Full Annual Report 2006 - Singapore Technologies Engineering
Full Annual Report 2006 - Singapore Technologies Engineering
Full Annual Report 2006 - Singapore Technologies Engineering

You also want an ePaper? Increase the reach of your titles
YUMPU automatically turns print PDFs into web optimized ePapers that Google loves.
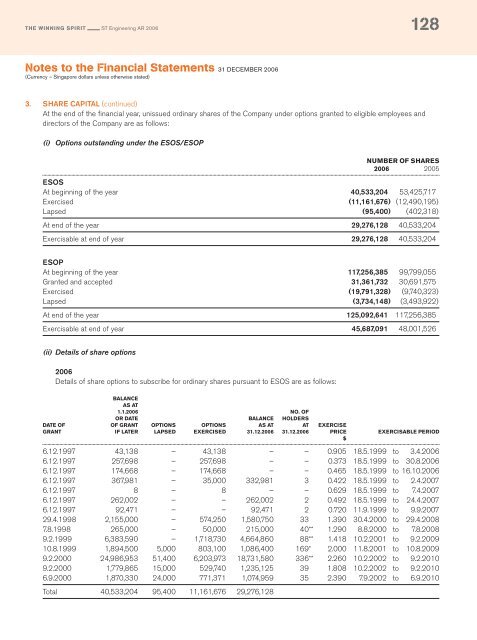
THE WINNING SPIRIT ST <strong>Engineering</strong> AR <strong>2006</strong> 128<br />
Notes to the Financial Statements 31 DECEMBER <strong>2006</strong><br />
(Currency – <strong>Singapore</strong> dollars unless otherwise stated)<br />
3. SHARE CAPITAL (continued)<br />
At the end of the financial year, unissued ordinary shares of the Company under options granted to eligible employees and<br />
directors of the Company are as follows:<br />
(i) Options outstanding under the ESOS/ESOP<br />
NUMBER OF SHARES<br />
<strong>2006</strong> 2005<br />
ESOS<br />
At beginning of the year 40,533,204 53,425,717<br />
Exercised (11,161,676) (12,490,195)<br />
Lapsed (95,400) (402,318)<br />
At end of the year 29,276,128 40,533,204<br />
Exercisable at end of year 29,276,128 40,533,204<br />
ESOP<br />
At beginning of the year 117,256,385 99,799,055<br />
Granted and accepted 31,361,732 30,691,575<br />
Exercised (19,791,328) (9,740,323)<br />
Lapsed (3,734,148) (3,493,922)<br />
At end of the year 125,092,641 117,256,385<br />
Exercisable at end of year 45,687,091 48,001,526<br />
(ii) Details of share options<br />
<strong>2006</strong><br />
Details of share options to subscribe for ordinary shares pursuant to ESOS are as follows:<br />
BALANCE<br />
AS AT<br />
1.1.<strong>2006</strong> NO. OF<br />
OR DATE BALANCE HOLDERS<br />
DATE OF OF GRANT OPTIONS OPTIONS AS AT AT EXERCISE<br />
GRANT IF LATER LAPSED EXERCISED 31.12.<strong>2006</strong> 31.12.<strong>2006</strong> PRICE EXERCISABLE PERIOD<br />
$<br />
6.12.1997 43,138 – 43,138 – – 0.905 18.5.1999 to 3.4.<strong>2006</strong><br />
6.12.1997 257,698 – 257,698 – – 0.373 18.5.1999 to 30.8.<strong>2006</strong><br />
6.12.1997 174,668 – 174,668 – – 0.465 18.5.1999 to 16.10.<strong>2006</strong><br />
6.12.1997 367,981 – 35,000 332,981 3 0.422 18.5.1999 to 2.4.2007<br />
6.12.1997 8 – 8 – – 0.629 18.5.1999 to 7.4.2007<br />
6.12.1997 262,002 – – 262,002 2 0.492 18.5.1999 to 24.4.2007<br />
6.12.1997 92,471 – – 92,471 2 0.720 11.9.1999 to 9.9.2007<br />
29.4.1998 2,155,000 – 574,250 1,580,750 33 1.390 30.4.2000 to 29.4.2008<br />
7.8.1998 265,000 – 50,000 215,000 40** 1.290 8.8.2000 to 7.8.2008<br />
9.2.1999 6,383,590 – 1,718,730 4,664,860 88** 1.418 10.2.2001 to 9.2.2009<br />
10.8.1999 1,894,500 5,000 803,100 1,086,400 169* 2.000 11.8.2001 to 10.8.2009<br />
9.2.2000 24,986,953 51,400 6,203,973 18,731,580 336** 2.260 10.2.2002 to 9.2.2010<br />
9.2.2000 1,779,865 15,000 529,740 1,235,125 39 1.808 10.2.2002 to 9.2.2010<br />
6.9.2000 1,870,330 24,000 771,371 1,074,959 35 2.390 7.9.2002 to 6.9.2010<br />
Total 40,533,204 95,400 11,161,676 29,276,128